
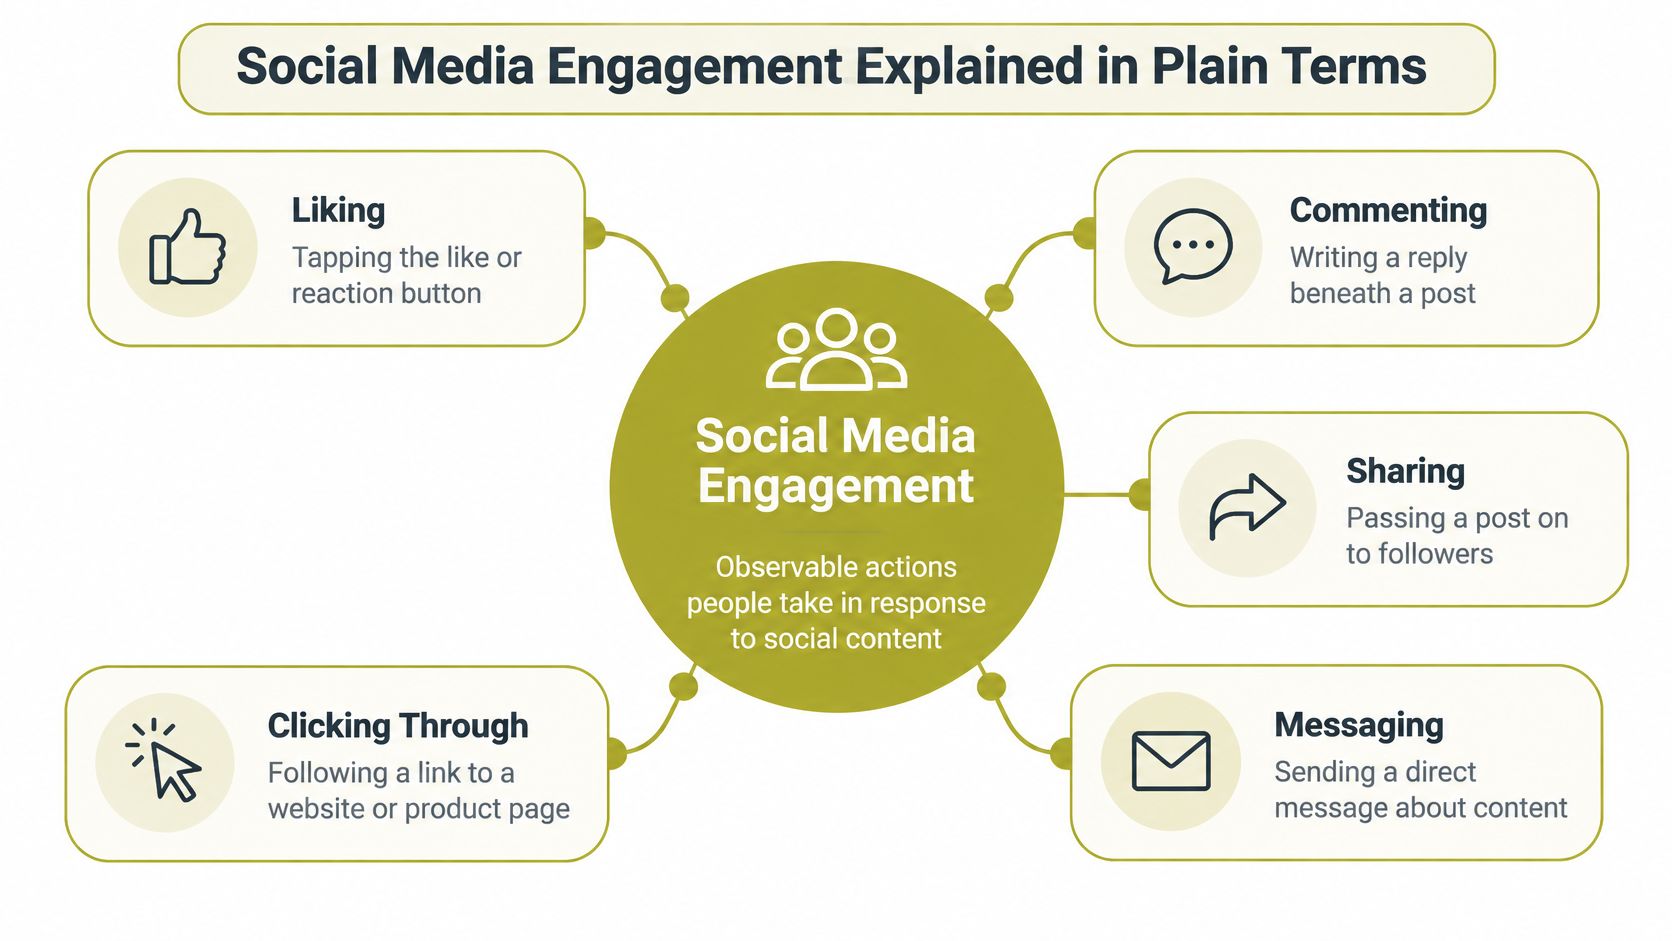
Social media engagement is the observable actions people take in response to social content, such as commenting, sharing, saving, messaging or clicking through, rather than merely seeing it.
You've published a post, checked the likes and wondered whether any of it helped your business. Perhaps your restaurant's menu attracted reactions but no booking enquiries, or your software company's post prompted a useful question despite modest reach. The useful question isn't just how many people noticed you. It's what they did next, what that action means and whether you responded appropriately.
Social Media Engagement Explained in Plain Terms
Take a bakery post: dozens of people scroll past, a few tap like, one asks whether the cake is gluten-free, and another saves it for the weekend. The views show reach. The question and the save are engagement because each person did something you can classify and act on.
A social account works like a market stall. Passers-by have noticed the display; the person who stops, tastes a sample and asks the price has given you a stronger signal. Attention is the floor. Engagement starts when someone goes beyond viewing.
The diagram shows common actions people can take after encountering your content.
The ladder from baseline attention to business outcome
| Level | Typical actions | What it signals | Effort for the user |
|---|---|---|---|
| Baseline attention (not engagement) | Views, reads, watches, scrolls past | Content was seen | Lowest |
| Light reaction | Likes, emoji reactions | Noticed and approved | Low |
| Active response | Comments, replies, poll votes | Opinion, question or concern | Medium |
| Amplification | Shares, reposts, saves | Passed on or kept for later | Medium to high |
| Intermediate action | Link clicks, profile visits | Intent to learn more | Medium |
| Private contact | Direct messages, enquiries | Direct interest in buying or booking | High |
| Business outcome | Purchases, bookings, form submissions | Commercial action completed | Highest |
Treat this ladder as a working classification, not a psychological test. A reaction may acknowledge a post without approving its message, a direct message may contain a complaint, and a click sits between interest and outcome. Effort also varies: clicking a link can be easier than writing a considered comment.
Comments deserve special care. A clear answer can build trust with everyone reading the thread, while an unanswered complaint, a misleading claim or personal details left in public create a small information-governance risk under your brand. Count the comment, then handle what it contains.
Practical rule: Classify the action before counting it as success, and keep views in the reach column.
Once you can tell attention from action, test a few tips to boost social engagement that push the response your business needs: a question answered, a save, a booking enquiry.
How Engagement Differs Across Social Platforms
Social media is part of everyday life, but that doesn't make every platform equally useful to your business. In 2024, 65% of adults in Great Britain reported using social media daily, according to the Office for National Statistics.
Purpose matters as much as frequency. UK social media statistics covering Ofcom's news research report that Facebook reached 30% of UK adults for news, while TikTok reached 11%, up from 1% in 2020. These are news-consumption figures, not measures of shopping behaviour or brand engagement.
Think of platforms as different rooms at a business event. A conversation that suits a professional roundtable may not suit an informal local gathering. You need to understand why people are there before deciding what to say.
Platform engagement signals and traps for SMEs
Use these as starting points for measurement, not universal rankings of what matters most.
| Platform | Signal that matters most | Typical SME use | Trap to avoid |
|---|---|---|---|
| Saves and shares sent to direct messages | Visual product, venue and behind-the-scenes posts | Likes that don't lead to visits | |
| Comments and group discussion | Local events, offers and community updates | Reach concentrated among existing followers | |
| Comments from named professionals and staff reposts | B2B thought leadership and case studies | Dismissing low volume that still holds high relevance | |
| X | Replies and quote posts | Announcements and real-time commentary | Fast decay and argument-driven replies |
| TikTok | Watch completion and shares | Short-form video and process content | Views that don't convert into followers |
| YouTube | Watch time and considered comments | Longer tours, guides and how-to content | Subscriber counts that lag behind view counts |
A saved Instagram venue post could indicate an intention to revisit the information. Check whether profile visits, website sessions or enquiries follow before interpreting that save as commercial interest. On LinkedIn, assess who commented and what they asked, rather than judging the discussion by volume alone.
Video needs a further distinction. Watch completion and watch time measure attention, while shares, questions and tracked website actions show different forms of participation. A viewer can value a guide without commenting, so don't describe every quiet viewer as disengaged.
For an initial choice, select two platforms where you have evidence your customers spend time, rather than maintaining accounts everywhere. This guide to starting social media marketing can help organise that decision. Compare results within each platform before trying to compare them across platforms.
Engagement Metrics, Formulas and Worked Examples
Every engagement rate needs a denominator, the quantity you divide by. Reach asks how many actions occurred relative to the audience reached; followers asks how many occurred relative to the account's follower base. Change the denominator and you change the question.
Think of it as measuring a shop's performance against passing footfall or its customer mailing list. Both comparisons may be useful, but they aren't interchangeable.
Core engagement formulas with worked examples
The calculations below are hypothetical teaching examples, not reported business results or industry benchmarks. Where a numerical example isn't needed, the calculation describes what to divide.
| Metric | Formula | Worked example | Indicative range |
|---|---|---|---|
| Engagement rate by reach | (Comments + shares + saves) ÷ reach × 100 | 100 ÷ 4,000 × 100 = 2.5% | No verified universal range; use your own baseline |
| Engagement rate by followers | (Likes + comments + shares + saves) ÷ followers × 100 | 280 ÷ 3,000 × 100 ≈ 9.3% | Varies by audience and account; use your own baseline |
| Active engagement share | Active actions ÷ total interactions × 100 | 100 ÷ 280 × 100 ≈ 35.7% | Track the trend rather than a universal target |
| Reply rate | Replies sent ÷ comments received × 100 | Divide replies sent by comments received, then express as a percentage | Assess against your response standard |
| Conversion from engagement | Tracked enquiries ÷ link clicks × 100 | 9 ÷ 310 × 100 ≈ 2.9% | Compare with your own website performance |
| Engagement per post | Total engagements ÷ posts published | Divide the period's engagements by its published posts | Compare within the same platform |
For reply rate, define the counting rule carefully. Count comments receiving a reply if your aim is response coverage; otherwise, repeated replies in a long conversation can make the result misleading. State whether spam and comments requiring no response are included.
What the calculations can and can't prove
The reach-based example counts active actions, not unique engaged people. Someone might comment and save the same post, so the resulting percentage shouldn't be described as the proportion of people who engaged. Similarly, follower-based engagement doesn't tell you how many followers saw the post.
Ofcom's Adults' Media Use and Attitudes research found that 59% of social-media users in 2023 posted, shared or commented, with 25% doing so often, while 22% usually only liked content and 18% mainly read it. These findings support separating participation by intensity, but they don't supply a target engagement rate for your SME.
A percentage without a named formula is an incomplete measurement.
Choose the metric to match the decision:
- Audience participation: Use active engagement by reach to examine responses among the audience reached.
- Service performance: Use reply coverage alongside response time and resolution.
- Commercial progress: Follow tracked clicks through to qualified enquiries and bookings.
- Publishing efficiency: Compare engagement per post alongside the effort required to produce it.
There's no verified universal benchmark here that justifies calling a particular percentage good. A consistent comparison with your own previous performance is more defensible than an attractive but unsupported industry target.
Why Engagement Matters for Visibility, Trust and Sales
Likes don't equal success. A busy comment section might contain useful questions, irrelevant arguments or a material error that nobody has corrected. You need to read the activity before deciding whether it helped.
Platform design also affects behaviour. Ofcom's research and data includes a behavioural audit conducted with the UK Behavioural Insights Team between December 2024 and January 2025, examining features affecting time online and user interactions; its UK evidence also records that 36% of social-media users followed brands in 2023.
That establishes a relevant context for brand communication, not proof that any particular reaction reflects preference. Treat an engagement dashboard like a vehicle's instrument panel: the readings help you decide what to do, but no isolated dial tells you whether you've reached your destination.
Illustrative engagement scenarios by sector
These are hypothetical scenarios showing decision-making logic, not reported client results. The actions are examples to consider, not guaranteed remedies.
| Sector and business | Headline pattern | Signal that mattered | Action taken |
|---|---|---|---|
| Tourism: a Highland walking-tour operator | Route video earned strong saves but few bookings | Saves and shares high, enquiries low | Added a booking link to the pinned post and a reply-with-your-route call to action |
| Hospitality: a city-centre restaurant | New menu post collected many likes | Comments asking about allergens went unanswered | Set a four-hour response standard and published an allergen FAQ post |
| B2B: a Scottish software SME | Thought-leadership posts drew few reactions | Named professionals commented on a product-process post | Offered relevant commenters a short case study, with permission-based follow-up tracked through UTM links |
| Seasonal hotel: a Scottish coastal property | Peak posts clustered in school holiday weeks | Engagement dropped sharply when conditions changed | Shifted to repeat-visitor content and tracked direct-booking clicks |
Match the evidence to the goal
For visibility, a relevant share demonstrates that someone passed your content to another audience. It doesn't establish how many recipients paid attention or whether they became customers. Keep subsequent reach separate from the original sharing action.
For trust, the restaurant's unresolved questions deserve more attention than its likes. Staff should provide checked information and an appropriate route for specific dietary enquiries, rather than offering casual assurances in a public reply.
For sales, distinguish curiosity from a qualified opportunity. The software business should examine whether commenters have a relevant need; the hotel should check whether booking clicks progress to completed reservations.
Understanding why social media marketing matters starts with these different purposes. The right signal is the one connected to the decision you need to make, not necessarily the largest figure in the report.
Set Your Engagement Baseline Before You Change Anything
Commit to a baseline before redesigning your content. Without one, you have no dependable comparison when you judge whether a change helped.
A baseline works like marking the water level before checking for a leak: you need a known starting point, consistent measurements and a record of anything else that changed while you watched.
Choose a practical observation period
A practical method is to collect 90 days of data from your main platforms and organise it into three consecutive months. Treat this as a working window rather than a threshold that guarantees reliable conclusions.
- Choose the outcome: decide whether you are improving useful discussion, enquiries, bookings or response quality.
- Keep definitions fixed: record the formula, the included actions and the reporting dates.
- Separate attention from action: log comments that need a checked reply apart from likes and reach, so the baseline reflects informed responses rather than silent viewing.
- Record exceptions: note paid promotion, closures, seasonal changes and unusually prominent coverage.
- Repair missing information: fix unanswered messages and untracked booking links before judging creative performance.
A stable pattern across that period gives you a usable starting point. It does not prove conditions will hold, especially for seasonal tourism and hospitality businesses. If the pattern shifts substantially, investigate the cause rather than averaging the difference away.
Decide what help you need
Three options cover most situations. The right choice depends on cost, the time you can give, the skills involved and who will handle public or press-facing comments, since those replies carry information-governance risk alongside their engagement value.
| Option | Main cost | Time needed | Skills required | Public responses |
|---|---|---|---|---|
| In-house | Staff hours | Fits around other duties | Basic analytics and record keeping | Your team replies directly |
| Freelance analyst | Project fee | Short setup | Supplied by the analyst | Usually reporting only |
| Agency | Retainer or project fee | Managed for you | Measurement plus communications | Can handle press-facing replies |
In-house work suits a business with spare staff time and straightforward questions to answer. A freelance analyst fits when you need the numbers built correctly but can manage replies yourself. An agency such as Carlos Alba Media, which provides public relations consulting, fits when public comments could turn into press or reputational questions.
Your first action this week is concrete: export the last 90 days of data for your main platform and complete the first row of a monthly report. Include the business outcome you wanted, not just the interactions you received.
How to Build a Monthly Engagement Report
A useful report should help an owner decide what to continue, stop or test. It shouldn't require them to decode a collection of dashboard screenshots.
Think of it as a management account for audience activity. You need consistent categories, a clear comparison and an explanation of anything unusual.
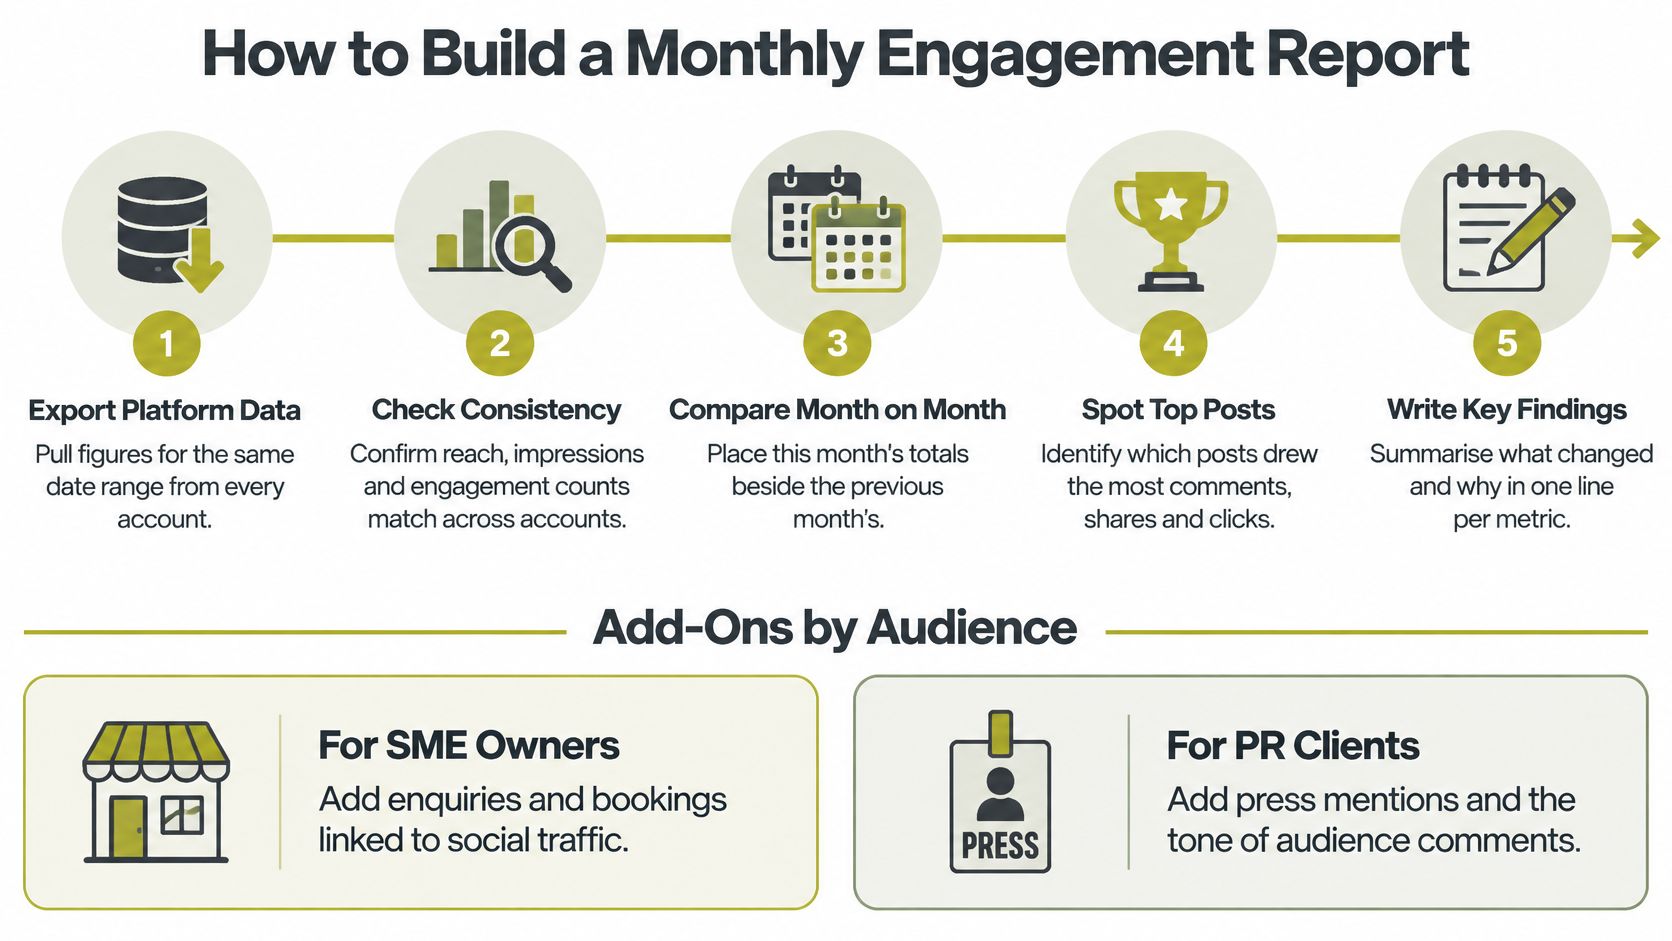
Use this visual checklist to organise the reporting process.
Build a repeatable reporting routine
- Export a consistent date range. Use the same reporting boundaries for every account so a longer period doesn't appear stronger merely because it contains more days.
- Check metric definitions. Record what each platform means by reach, impressions and interactions; don't assume identically named columns are interchangeable.
- Classify each post's results. Separate passive attention, active responses and business outcomes so the report preserves their different meanings.
- Calculate the agreed rates. Compare like with like against your baseline, keeping paid and organic activity distinguishable.
- Connect traffic with outcomes. Use UTM parameters, the labels added to campaign links, to match attributable visits with tracked enquiries or bookings.
- Record publishing context. Keep content type, posting time and call to action beside each post's results so you can investigate patterns.
Tracking has limits. A missing campaign label, a later direct visit or an enquiry made by phone can leave the original social interaction unattributed. Describe those gaps rather than presenting tracked enquiries as a complete account of social media's contribution.
Add what the decision-maker needs
For an SME owner, include qualified enquiries, bookings and unresolved customer questions. If sales information isn't available, say so explicitly. Don't substitute clicks and label them revenue.
For PR work, include links to coverage shared on social media, the tone and substance of audience comments, and response times for escalated items. Distinguish criticism of the business from criticism of the publication or wider issue.
Report uncertainty as clearly as improvement. A pattern drawn from a small collection of posts is a prompt to investigate, not proof of a lasting trend.
As a cautious working rule, treat comparisons involving fewer than around ten posts as tentative, not as a statistical threshold. Check whether a single unusual post accounts for the apparent change.
Finish with a one-page summary containing three findings, one change to test next month and one metric to watch. Those are reporting recommendations, not performance benchmarks. Never lead with total followers as proof of success; lead with the finding that matters to the business.
Practical Tactics That Lift Engagement
Start with a specific behaviour you want to encourage, then test whether your content makes that behaviour easier. Don't expect a lift just because a format is fashionable.
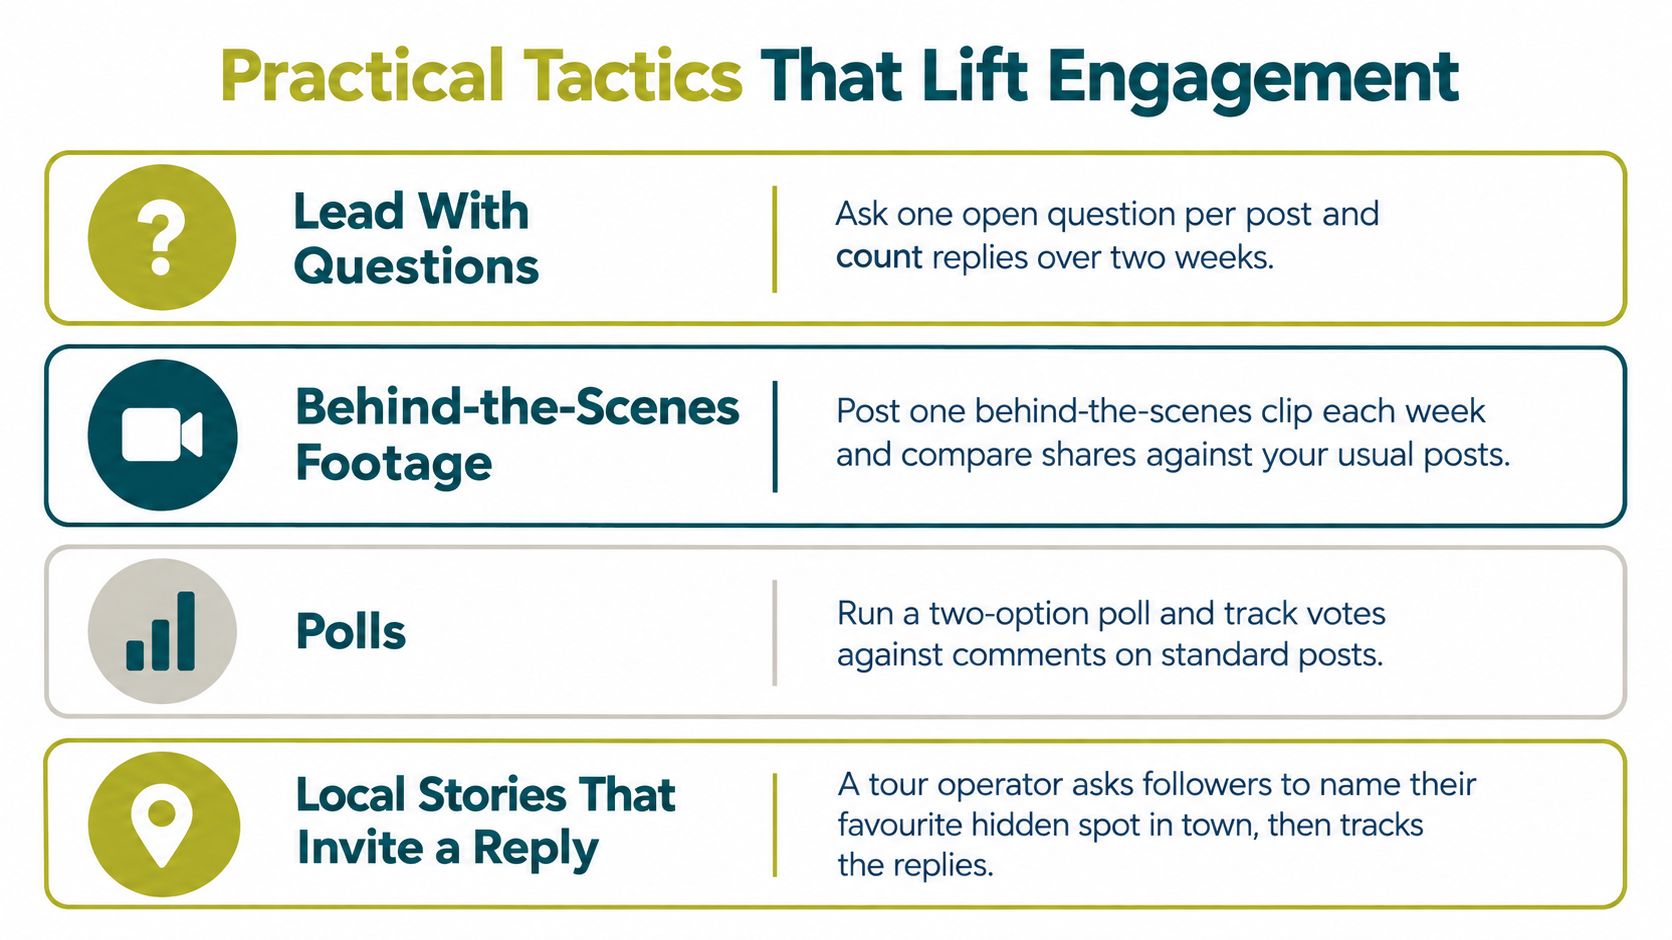
These ideas offer practical prompts for content experiments.
Test content, timing and the request
Content needs an answerable invitation. A tour operator could ask which route followers want explained next, then compare relevant replies with those on its usual promotional posts. Behind-the-scenes footage, polls and local stories are alternatives to test, not guaranteed winners.
For video production experiments, ShortGenius AI UGC video ads is an AI video and ad-generation option to evaluate alongside filming your own staff or commissioning a creator. Review accuracy, permissions and presentation before publishing, and don't present synthetic material as a genuine customer testimonial.
- Timing test: Use your audience analytics to choose two posting windows and compare them over two weeks, holding other elements as steady as practicable.
- Call-to-action test: Give each post one clear request, such as saving a route guide or asking a booking question, rather than competing instructions.
- Content test: Compare a useful process explanation with your usual promotional approach, using the same intended action.
These are proposed test designs, not evidence that a particular schedule or request will improve results. If audience composition or distribution changes, record that before crediting the creative.
The following video offers another resource to consider alongside your own tests.
Treat comments as information governance
A comment section is like the questions asked after a public presentation. People hear your answer, but they also hear the claim that prompted it. Leaving a misleading statement unaddressed can make the surrounding discussion harder to interpret.
A University of Exeter study involving more than 10,000 participants across Germany, the UK and Italy found that ordinary users' comments sometimes helped people identify false information, while misleading comments could undermine trust in accurate information. This doesn't mean every critical comment is misinformation or should be removed.
Build a response policy rather than relying on courtesy:
- Genuine questions: Give checked answers and identify who owns any follow-up.
- Praise: Acknowledge it without treating it as evidence of purchase intent.
- Criticism: Address the substance and move personal details to an appropriate private channel.
- Misinformation: Correct material errors, preserve useful context and escalate legal, safety or reputational risks to a named person.
You might adopt four working hours on weekdays as a proposed response standard, provided someone can meet it. A fuller approach to community management should also define cover, approval responsibilities and escalation routes.
A high comment count is not automatically a healthy conversation. Judge whether people received accurate answers and whether your team handled risk, as well as whether they replied.
Carlos Alba Media offers social media strategy, community management and senior communications counsel to help businesses connect audience activity with meaningful outcomes. Visit Carlos Alba Media to discuss your current reporting, unanswered audience questions and the engagement goals that matter to your business.