

Your homepage looks fine on a desktop screen, but a buyer on a train in Glasgow opens it on a phone, waits, taps back, and never comes back. That's how web performance hurts a small business in real life, often before anyone calls it a technical problem. Slow pages chip away at trust, make visitors work harder than they should, and turn a promising enquiry into a lost one.
Carlos Alba Media approaches that problem with newsroom clarity and delivery discipline. The agency's team blends former national news journalists with people who've worked with international brands, so performance advice has to be clear, practical, and grounded in the way real users behave. For SMEs, that matters because a site isn't just a brochure, it's part of sales, service, and reputation all at once.
Introduction
A customer lands on a local service page, sees the header load, then waits while the main content stutters into view. A minute later, they've already moved on to a competitor whose site feels easier to use. That's the hidden cost of poor performance, lost momentum, lower confidence, and fewer conversions before a sales conversation even begins.
What makes this harder for SMEs is that the problem often hides behind a site that looks acceptable at a glance. The branding can be sharp, the copy can be strong, and the offer can be solid, but the experience still feels sluggish on a real phone with a real connection. That gap between appearance and experience is where performance work earns its keep.
Carlos Alba Media's specialist nature fits this challenge well because it combines editorial precision with execution. When a business needs performance advice, it usually doesn't need jargon, it needs someone to explain what's slowing the site, what matters most, and what to fix first. That's the lens used throughout this guide.
Understanding Web Performance
A page can load, yet still feel hard to use. The content might appear on screen, but if the user waits to act, sees elements shift, or has to guess whether the site is responding, the experience still feels slow. Load time, interactivity, and visual stability are the three user experiences that make web performance easier to understand.
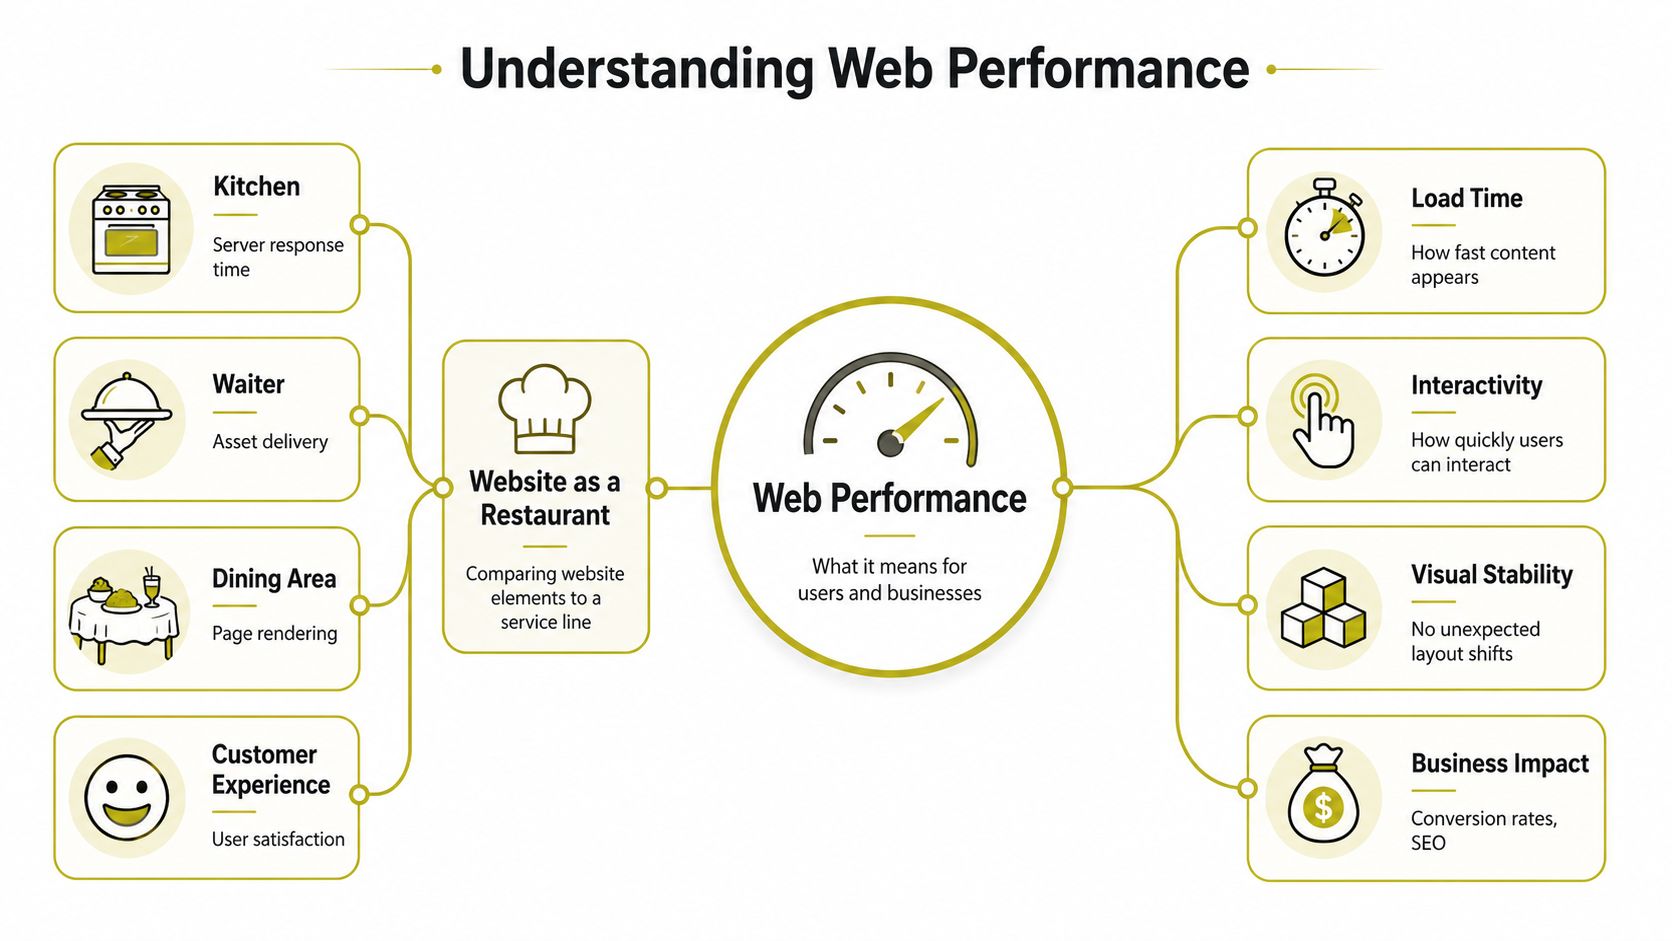
What performance really means
MDN describes web performance as both the measurable speed of a site and the experience a user feels, and it also points out that devices and network conditions can change that experience in real life (MDN on what web performance is). A site may look fine on a fast office connection, then feel slow on an older phone with a weaker signal. That gap matters because the visitor judges the site by what happens on their screen, not by what happened in a test environment.
For SMEs, the lesson is straightforward. A page can look finished while still behaving like a crowded reception desk, with visitors waiting for attention instead of moving through the site naturally. Web performance covers that full experience, so it includes more than one speed score or a single loading moment.
Practical rule: if a customer feels friction, the site has a performance problem, even if a dashboard shows the page loaded.
Why field data beats a one-off test
A one-time lab test can miss the way people use a site. Real visits vary by phone, browser, network strength, and location, which is why field data gives a clearer picture of day-to-day performance. The DOM Studio performance guide is useful here because it keeps the focus on practical optimisation rather than theory.
Carlos Alba Media's user experience guidance makes the same point from a different angle, performance only makes sense when it supports the wider customer journey. That is the part many SME sites miss. They may pass a quick check, yet still feel slow or uncertain on a real device, on a real network, in the middle of a real task.
Core Web Metrics Explained
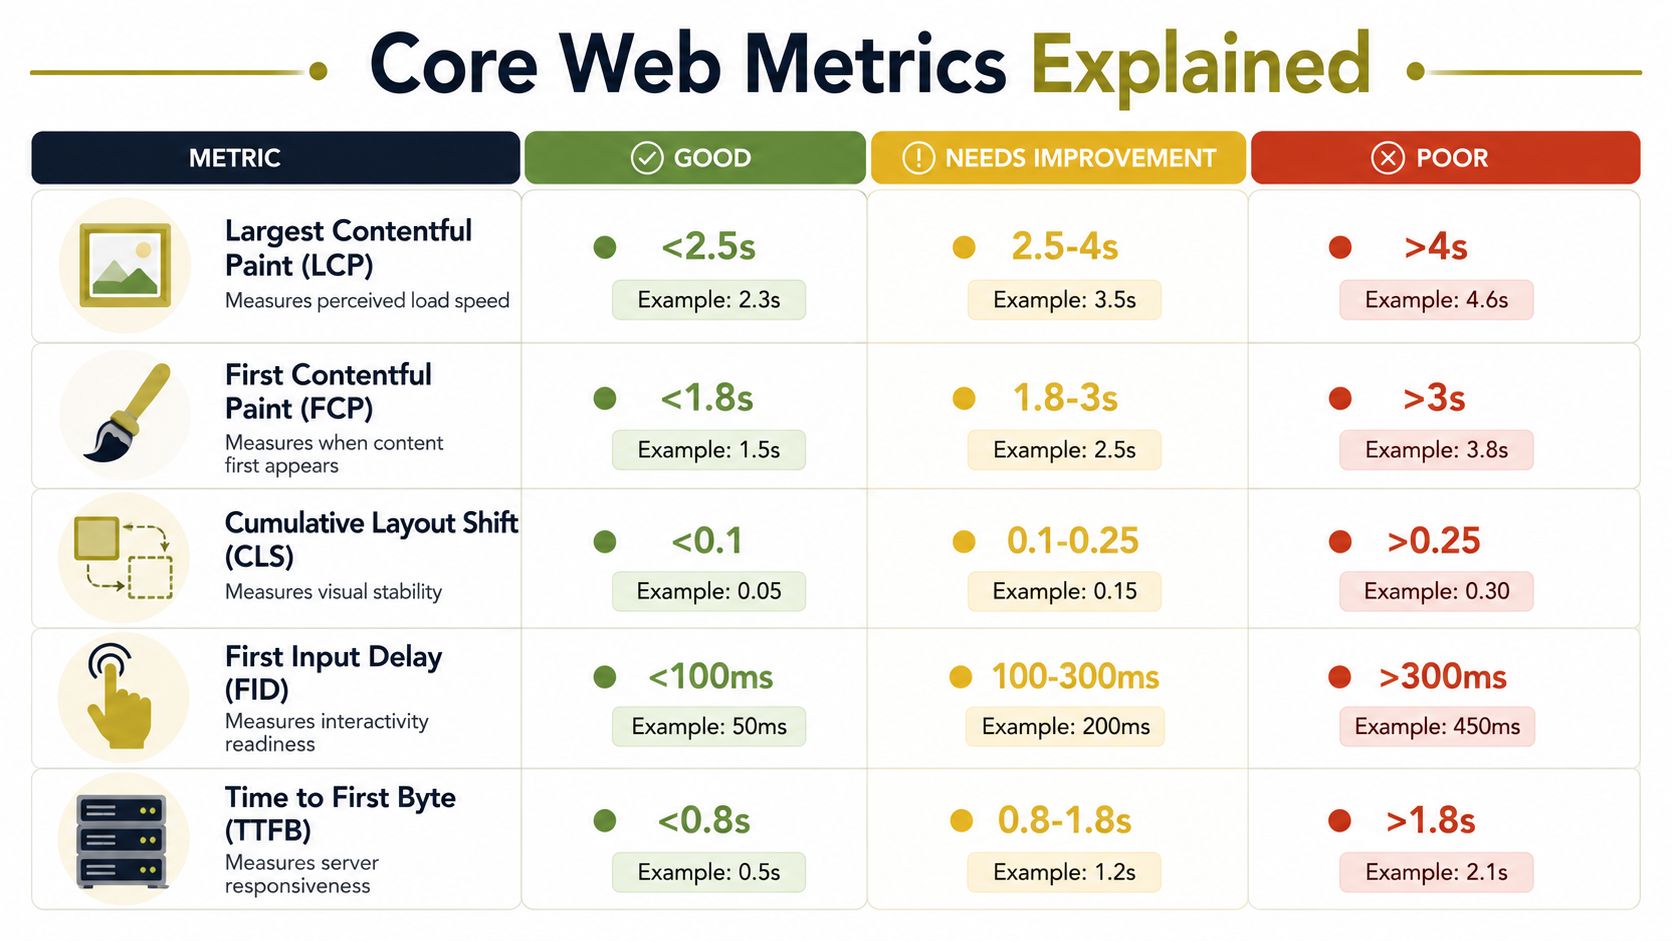
The easiest way to understand performance metrics is to treat them as different moments in the same visit. One tells you when something first appears, another tells you when the page feels usable, and another tells you whether the layout behaves itself. Google groups the main user-facing signals into Core Web Vitals, and the good thresholds are LCP within 2.5 seconds, INP under 200 milliseconds, and CLS below 0.1 at the 75th percentile of page loads (Google Core Web Vitals).
The five metrics that matter most
Largest Contentful Paint, or LCP, measures when the biggest visible content finishes loading. Think of it as the moment the main dish lands on the table. If that moment drags, the site feels slow, even if smaller bits have already appeared.
First Contentful Paint, or FCP, is the moment the browser shows the first visible content. It's the equivalent of the starter arriving, a sign that the kitchen is awake and things are moving. Cumulative Layout Shift, or CLS, measures visual stability, so pages score badly when buttons, images, or text jump around while the user is trying to read or tap.
First Input Delay, or FID, is the delay between the user's first interaction and the browser's response. It's useful as a responsiveness check, and current guidance also treats INP as the interactivity signal to watch. Time to First Byte, or TTFB, is the interval between the request and the first byte from the server, so it shows how quickly the server starts answering in the first place (Catchpoint metrics guidance).
A site can feel broken long before it's technically broken.
The thresholds SMEs should keep in view
A practical benchmark often used in current guidance is that a good page-load score should be under 2.5 seconds, with good First Input Delay below 100 milliseconds (Cloudinary web performance guide). That doesn't replace Core Web Vitals, but it gives non-technical teams a useful shorthand. If a page can't meet those kinds of numbers, it's worth asking which part of the journey is dragging.
For a step-by-step resource that sits well alongside this benchmark-driven approach, the Core Web Vitals optimisation guide is a useful companion. If you're reviewing your own site, the point isn't to chase every metric equally. It's to identify which one is most obviously hurting the experience and deal with that first.
Measuring Performance with Tools
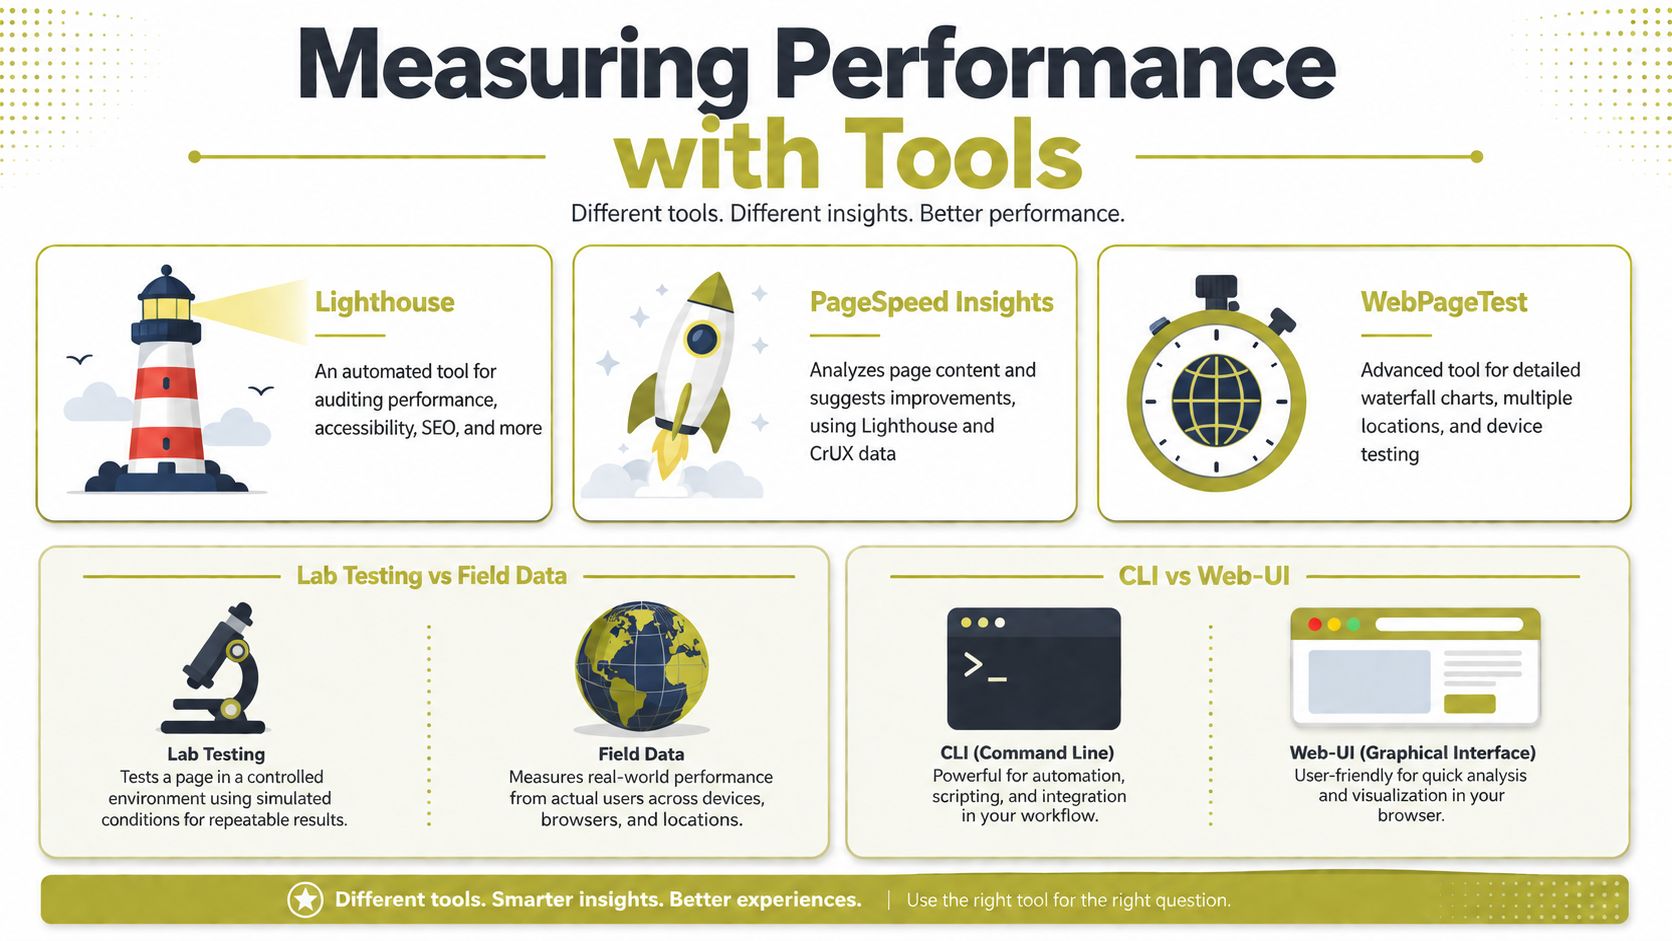
A practical performance check starts with the question you need answered. A quick audit tool will help you spot obvious issues on a single page, while a more detailed tester will show how that page loads under different conditions, devices, and network routes. For an SME site, that difference matters. A homepage that looks fine on office Wi-Fi can feel sluggish on a crowded mobile connection, especially if images, scripts, or third-party widgets are doing too much work.
Lighthouse is the fastest way to run a page audit and surface clear performance, accessibility, SEO, and code issues. PageSpeed Insights is useful when you want lab results and field data side by side. WebPageTest gives a more forensic view, which helps when you need to see the request waterfall, compare locations, or inspect how a layout behaves on different devices. The MDN on web performance resource is a good reference point if you want the broader standards context behind these tools.
Lab tests and real-user data
Lab tests simulate performance in controlled conditions. They are useful for isolating a problem, but they do not show every visitor's real experience. Field data comes from actual users, so it is better for understanding what happens on UK mobile networks, older phones, and uneven connections.
That distinction matters because a page can look healthy in a synthetic test and still frustrate the people you want to convert. A local service business may see a tidy score in a lab, then discover that customers on mobile are waiting too long for the enquiry form to appear. For SMEs, field data is usually the better place to start when deciding what to fix first.
How to use the tools without overcomplicating it
Open Lighthouse when you need a quick audit of one page and a clear list of obvious fixes. Use PageSpeed Insights when you want to compare what the lab shows with what users are experiencing. Turn to WebPageTest when you need a closer look at load behaviour, especially on pages that rely on heavy imagery, third-party scripts, or complex layouts.
The workflow should stay simple. Test a key page, identify the biggest bottleneck, make one meaningful change, then test again. That keeps the work tied to visible improvement instead of endless tweaking. If your next step is a page that needs to turn visits into enquiries, Carlos Alba Media's landing page best practices guide is a useful companion.
Web Performance and Business Impact
A slow site does not just feel awkward, it adds friction at the exact point where a visitor is deciding whether to enquire, call, or buy. In practical terms, performance shapes how much value you get from the traffic you already pay for, earn, or attract through search.
A local trades company can see this clearly. The ad might bring the right visitor to a service page, but if the page waits too long to show the contact form, some people leave before they ever read the offer. A clinic, agency, or retailer can face the same problem on mobile, where a page that loads cleanly on a desktop feels sluggish on a real phone over a patchy connection.
That is why performance belongs in the same discussion as acquisition, conversion, and trust. A site that feels quick and steady gives people less reason to hesitate, which is exactly what a sales page, service page, or enquiry flow needs. If you are shaping a page around action, the landing page best practices resource from Carlos Alba Media is a useful companion for connecting speed with page intent.
Search and conversion outcomes are linked to how well a page performs on real devices and real networks, not just in a controlled test. Signals such as LCP within 2.5 seconds and responsiveness targets like FID below 100 milliseconds are associated with stronger conversions and SEO rankings in UK business contexts, as noted in the Cloudinary web performance guide. That does not mean speed alone creates growth, but it does mean poor performance can limit the return on the marketing work already in place.
Performance also shapes how accessible a site feels. Slow loading, layout shifts, and delayed interaction make it harder for keyboard users and assistive technologies to keep pace with the page. Good performance supports a better experience for everyone, including people on older devices and less predictable connections.
Common Bottlenecks and Optimisation for SMEs
A small SME site rarely slows down because of one obvious fault. More often, it accumulates drag from several places at once, render-blocking scripts, heavy third-party tools, oversized images, and page templates that ask the browser to work too hard before anything useful appears. That is why the highest-value fixes are often the simplest to apply.
Start with the biggest drag factors
Many teams begin by trimming unnecessary external services. A practical rule is to keep unique third-party domains below six per page, because each extra dependency adds another handoff before the page can settle. Guidance from Catchpoint metrics guidance also points to CDN delivery and async JavaScript as useful ways to improve TTFB, FCP, and Core Web Vitals. The idea is straightforward. Fewer moving parts usually mean fewer delays.
For an SME, the usual suspects are chat widgets, trackers, social embeds, and ad scripts. Each one may look small in isolation. Together, they can make the first interaction feel slow enough that visitors sense the site is working against them.
Fixes that don't require a rebuild
Images are often the easiest place to start. Resize them to the display size they need, compress them properly, and lazy-load anything that does not need to appear right away. Then look at JavaScript and let non-critical scripts load later with async or defer, so they do not hold up the rest of the page.
Caching matters as well, especially for return visitors who are opening the same pages again. A sensible cache setup lets the browser reuse assets instead of fetching them repeatedly. If your team would rather avoid the technical side, managed hosting for non-technical business owners can be a practical route to compare.
Structure can slow a site too. If the template loads too many fonts, sliders, and animation libraries on every page, the browser does extra work before the user sees anything useful. In that situation, simplification usually delivers more value than decorative polish.
For design choices that balance appearance with speed, the best web design for small business guide from Carlos Alba Media is a useful companion. Performance-focused design does not need to look bare. It needs to stop the browser from fighting for every frame.
SME shortcut: if a page feels heavy, remove one third-party tool before you redesign the whole site.
SME Web Performance Audit and Next Steps
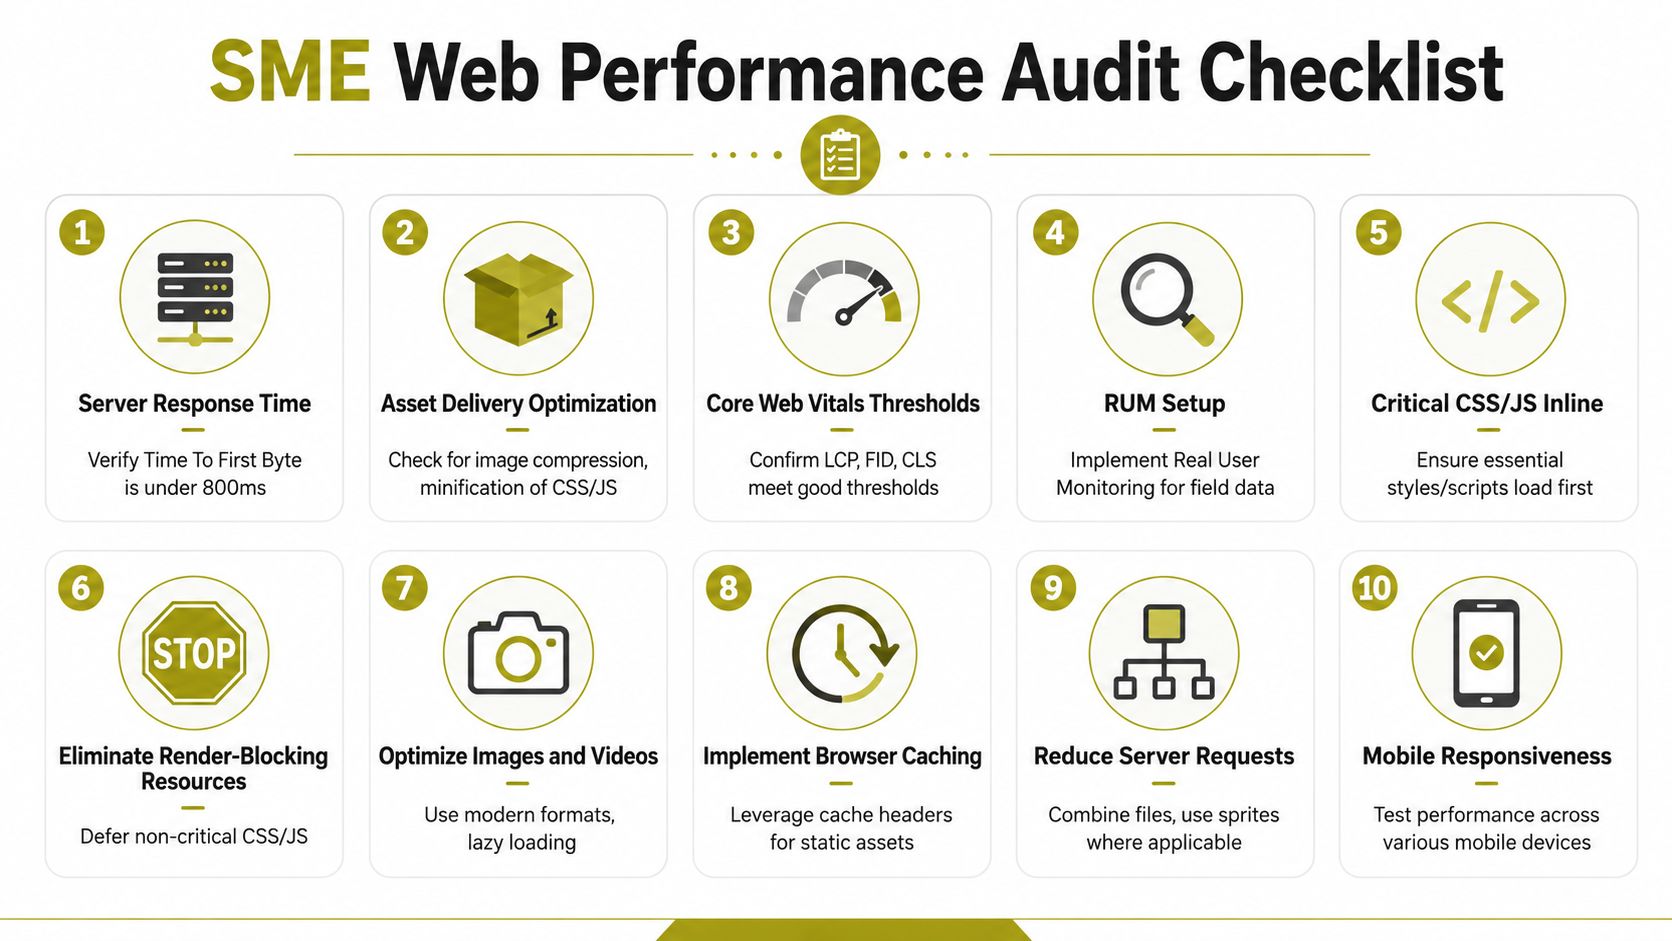
A useful audit doesn't need to be complicated. It needs to tell you whether the site loads quickly, stays stable, and responds well enough for people to keep going. The UK Government Digital Service is clear that good performance means pages load quickly and allow users to interact easily, which is why specialist execution matters (GDS performance guidance).
A simple 10-point check
- Server response time, check whether the server starts answering quickly.
- Asset delivery, review image compression and code minification.
- Core Web Vitals, confirm LCP, FID, and CLS are in good shape.
- Real User Monitoring, gather field data from actual visits.
- Critical CSS and JavaScript, make sure essential code loads first.
- Render-blocking resources, defer what doesn't need to run immediately.
- Images and video, use lighter formats and lazy loading where sensible.
- Browser caching, make repeat visits faster.
- Request volume, cut unnecessary calls where possible.
- Mobile responsiveness, test on real phones, not just a desktop browser window.
What to do after the audit
Start with the pages that matter most, usually the homepage, service pages, and any landing pages tied to campaigns. Then set a recurring review rhythm so performance doesn't slide back after a new plugin, design refresh, or content update. If the team doesn't have time to manage that in-house, bring in help before small issues turn into habitual ones.
For SMEs that want both editorial clarity and technical execution, Carlos Alba Media is one option among several. The important thing is to choose a partner that measures performance on real devices, explains the findings in plain English, and treats the site as a business asset rather than a design object.
Final Thoughts on Web Performance
Web performance is the difference between a site that merely exists and a site that feels easy to use. The strongest approach combines real-user data, clear thresholds, and a practical fix list, then keeps improving instead of stopping at one round of tweaks. For SMEs, that's often the point where a website starts pulling its weight properly.
If you want a sharper, faster site and you'd rather work with a team that explains things plainly, speak to Carlos Alba Media.