
Overall UK e-commerce converts about 1.7% of sessions, and the sector, device and traffic source change that figure considerably. That means most visits don't end in a purchase, even on competent sites. A low conversion rate website result isn't proof that the design is weak. It's a diagnostic signal. Trust, delivery and accessibility problems can suppress orders while the pages look finished, so your first job is to find where, and why, people stop.
Typical Website Conversion Rates in 2026
The published range for UK conversion rates runs from 1.30% in Food and Drink to 3.4% in one UK ecommerce compilation, while a global landing-page median sits at 6.6%. Those figures are not interchangeable. Each measures a different denominator, sample and traffic mix, so the first task is to identify what a benchmark counted before comparing it with your own site.
IRP Commerce UK e-commerce market data put the overall average at 1.68% in September 2025, with Food and Drink at 1.30%. For Great Britain, Statista's online shopper conversion data recorded approximately 1.67% in the first quarter of 2026, down from approximately 1.75% in the first quarter of 2025. The year-on-year fall is small in absolute terms, 0.08 percentage points, but it points to a softer purchase rate in that sample rather than a universal decline.
Other compilations produce higher averages because they use different samples. WIRO's compilation of UK ecommerce statistics reports UK ecommerce conversion rates averaged approximately 3.4% in 2025. Monext's summary of IRP Commerce data puts the average UK ecommerce conversion rate at about 3.1% across sectors in 2025, while UK Shopify stores averaged approximately 1.7% conversion in 2025 according to Littledata data cited by Lightly Salted. The broader landing-page figure is different again. TechTimes' report citing Unbounce's Conversion Benchmark Report gives a median landing-page conversion rate across industries of 6.6% in 2024, and that is not a UK-only figure.
UK and Global Conversion Rate Benchmarks
| Benchmark | Conversion rate | Scope | Year |
|---|---|---|---|
| UK e-commerce overall average | 1.68% | Tracked UK e-commerce market, September 2025 | 2025 |
| Great Britain e-commerce websites | 1.67% | Great Britain online shoppers | Q1 2026 |
| Food and Drink, UK e-commerce | 1.30% | Sector benchmark, September 2025 | 2025 |
| UK Shopify stores | 1.7% | Littledata data cited by Lightly Salted | 2025 |
| UK ecommerce average (WIRO) | 3.4% | UK ecommerce statistics compilation | 2025 |
| UK ecommerce average (IRP Commerce via Monext) | 3.1% | Across sectors | 2025 |
| Median landing-page rate (Unbounce) | 6.6% | Global, all industries, not UK-only | 2024 |
The table works as a set of reference points, not a league table. The 6.6% landing-page median often comes from campaign-specific pages with a single action. A full store carries navigation, delivery choices and returns policy before checkout. A 1.3% sector figure can describe a category where visitors compare across several sites before buying. Neither number says whether the site is well designed. The averages disagree because the samples, sector mixes and denominators differ. Some count sessions, others lean closer to unique visitors, and a landing page built for one campaign is not comparable with a full online store.
Teams comparing performance across channels can use conversion benchmarks for growth teams as a sense check, provided they do not replace their own sector baseline with a generic target.
Practical rule: A site generating research-stage leads for high-value services can sensibly convert below a retailer receiving branded purchase traffic.
A three-step self-check keeps the comparison honest. Find your own session-based figure, find the closest sector row above, then note the gap in percentage points, not as a vague percentage improvement. That gap is your starting question, not your verdict.
How to Calculate Your Website Conversion Rate
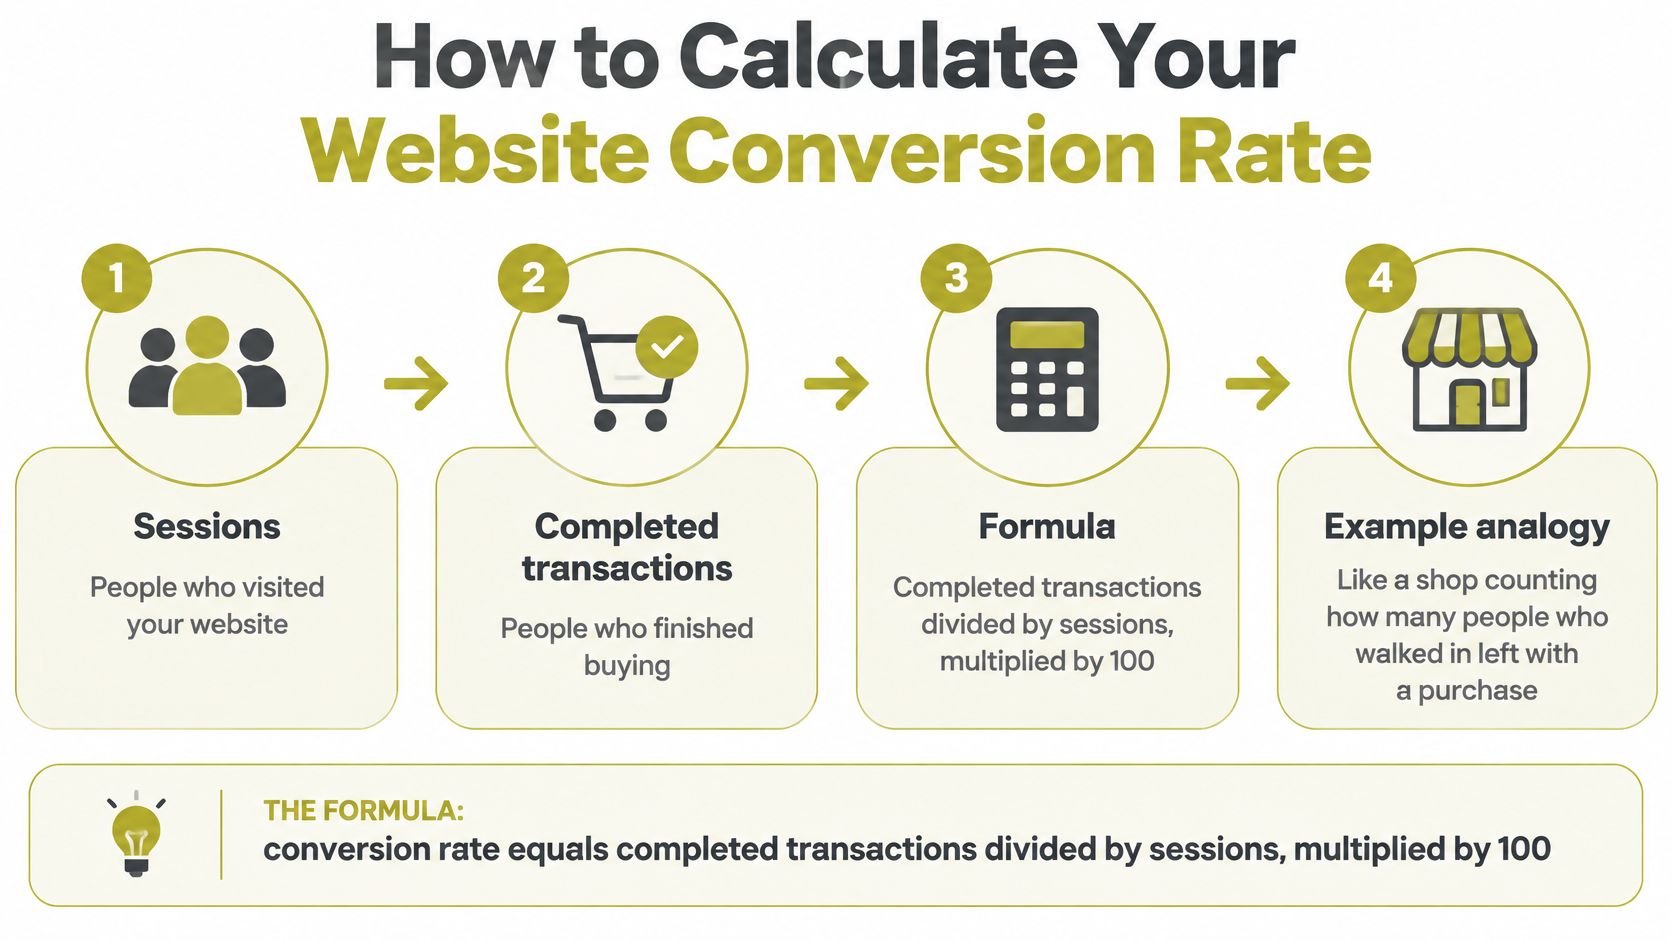
The formula is simple. Conversion rate equals completed transactions divided by sessions, multiplied by 100. It's like a shop counting how many people who walked in left with a bag, not how many people walked past the window. If a visitor returns tomorrow, that's a new session and a new chance to buy, which is why sessions and unique visitors aren't interchangeable.
Here's a worked example. Say your site records 3,200 sessions and 54 orders over four weeks. Divide 54 by 3,200, then multiply by 100. Your conversion rate is 1.69%. That figure measures completed purchases per visit. It doesn't tell you what share of individual people bought, because one person can start several sessions before ordering.
The diagram below summarises the calculation before you apply it to your own analytics.
The Five Steps That Keep the Figure Honest
- Define the conversion event: Use a completed order for e-commerce, or a form submission for a lead-generation site, and don't mix the two.
- Choose at least four weeks: A longer window smooths weekly swings from paydays, promotions and campaign launches.
- Divide and multiply: Divide conversions by sessions and multiply by 100, using the same date range for both numbers.
- Segment the result: Split by device, traffic channel, landing page and new versus returning visitors, because each group arrives with different intent.
- Record the sample size: Write the sessions and conversions beside the rate, so later comparisons don't treat a tiny sample as a trend.
A blended figure hides problems. A strong desktop rate can mask a weak mobile rate, and branded search can flatter a page that's failing cold social traffic. You're looking for a stable figure across four weeks, with segments that explain any movement. If the headline rate rises while mobile falls, you haven't improved the site for everyone. You've changed the mix.
Where to Read the Numbers
In GA4, mark purchase or generate_lead as a key event, then read the rate in Traffic acquisition and Landing page. Reconcile it with the ecommerce purchases report, or with your form tool, so a tag that fires twice can't inflate the numerator. Treat a platform dashboard, including a Shopify report, as a check on that same numerator. Keep the four-week window and the device and channel segments switched on throughout, or you'll compare two different definitions and call the difference growth.
Where Visitors Drop Out Before They Buy
A checkout that works can still lose most of its baskets. Interest becomes revenue only when each funnel stage passes visitors to the next, so measure the stages in order: product or service view, add to cart or enquiry, checkout start, payment, completed order. Compare each stage with the one before it and find the largest relative drop-off. That stage is where optimisation earns its keep, not the homepage by default.
Funnel Stages and Diagnostic Measures
| Funnel stage | What to measure | What it tells you |
|---|---|---|
| Add to cart | Your own add-to-cart rate per product or service view | Interest that hasn't yet become revenue |
| Completed purchase | Your own completed purchases per session | Final conversion per visit |
| Checkout abandonment, all devices | 74% of baskets (Q4 2024) | Scale of checkout friction |
| Checkout abandonment, mobile | 76% | Mobile checkout needs its own funnel |
| Checkout abandonment, desktop | 67% | Baseline for comparing devices |
| Payment authorisation success | Your own completed payments per payment attempt | Orders lost after checkout starts, measure your own |
The checkout figures are the warning. The Leeds Beckett University Retail Institute checkout abandonment study found approximately 74% of baskets created in the final quarter of 2024 didn't become completed orders, with abandonment at 76% on mobile devices and 67% on computers. Preventing friction at checkout therefore beats depending on remarketing to recover baskets later.
Treat mobile checkout as a separate funnel, not a shrunken desktop page. Smaller touch targets, longer form completion, weaker autofill and payment friction give mobile users more chances to fail through no fault of their own. Segment by device, browser, payment method and checkout step, then fix the step with the steepest relative fall. Practical fixes include fewer required fields, browser and wallet autofill, delivery cost and timing shown before payment, and form data preserved after a validation error.
A technically working checkout can still lose orders through failed payment authorisation or an error message that doesn't say what to correct.
Say checkout starts look healthy but completed orders don't. Check checkout-start-to-order conversion beside payment-authorisation success before you redesign anything. A structured website conversion audit helps you sequence that diagnosis, and you can prioritize landing page tests using data once the widest gap is clear. Don't spend on the earliest stage if the leak is at payment.
Trust, Delivery and Accessibility Barriers to Fix
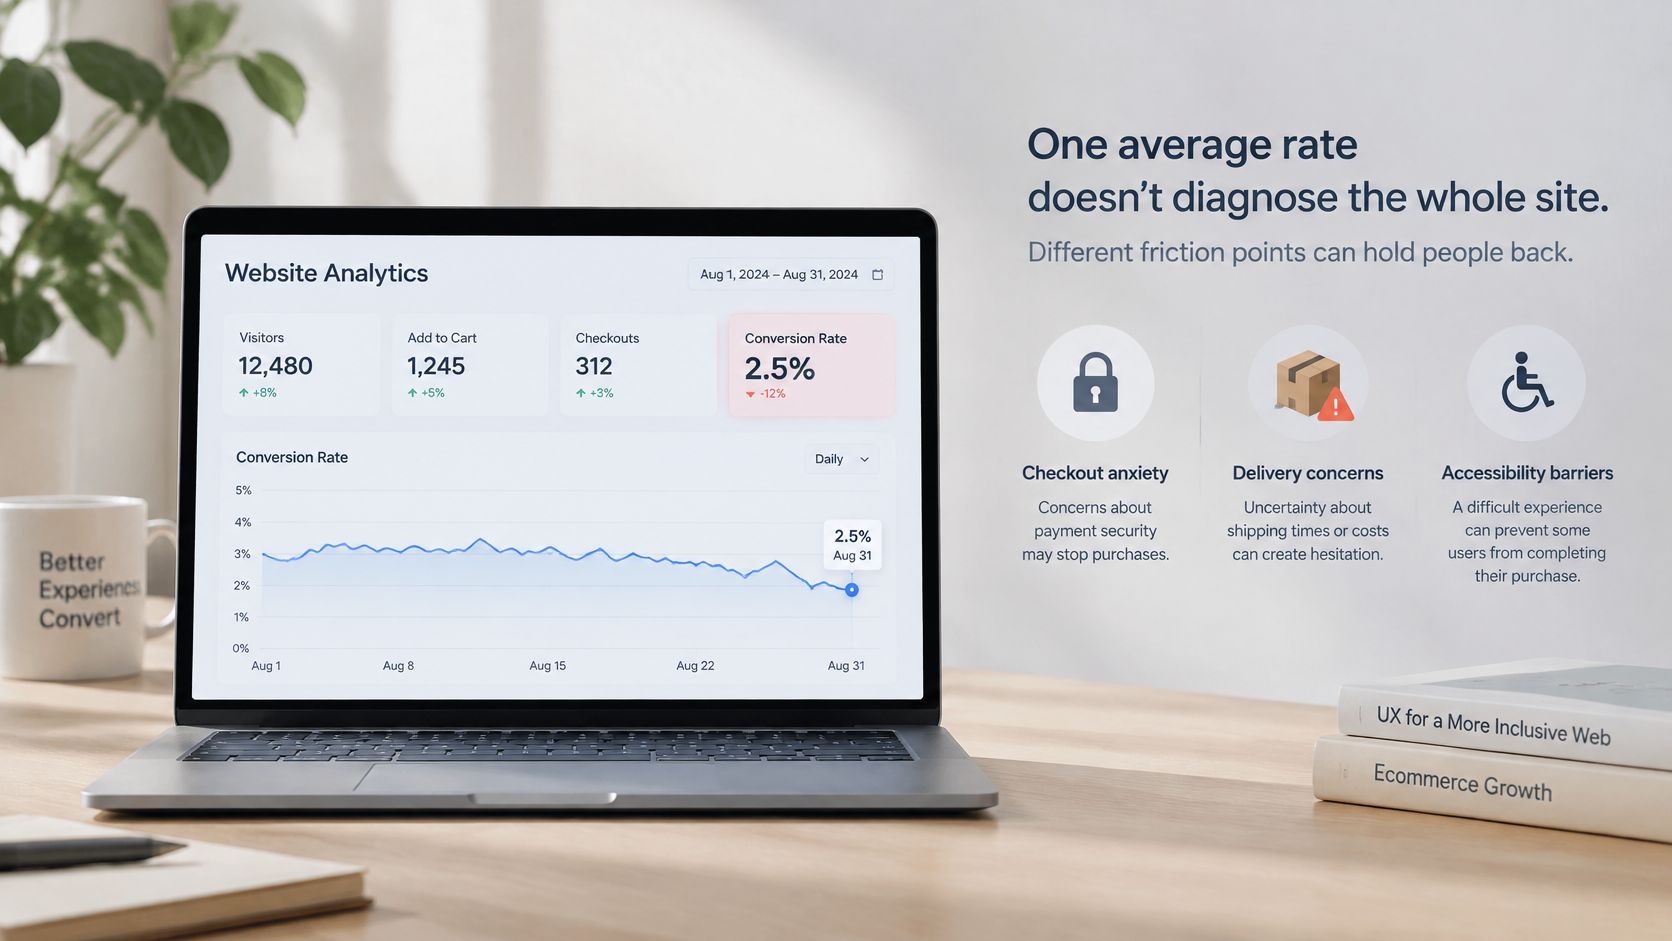
One average rate can't diagnose your site. A low figure may reflect checkout anxiety or an operational block on a page that already looks polished. The image below shows the kind of dashboard view that helps you connect a barrier to a specific funnel event.
Payment Security Comes Before Persuasion
In a 2025 survey reported by Startups.co.uk in its abandoned carts coverage, 52% of more than 2,000 UK adults had abandoned a cart because of concerns about payment security, and nearly 60% refused to pay on unfamiliar websites. That is a trust problem, not a button-colour problem. Place recognisable payment marks and the card or wallet choice where the total appears, then count how many checkout starts reach payment success. If that step doesn't move, your reassurance is decorative.
Delivery expectations carry the same weight. UK research cited in that coverage found 59% of shoppers had abandoned a purchase or retailer because delivery options failed to meet expectations, and the estimated value of non-food online sales lost at checkout for delivery-related reasons was £36 billion in 2025. Show cost and timing before payment, not on the final screen. A surprise delivery charge asks the buyer to restart a decision they'd already made.
The short video below is a useful prompt to inspect friction from the visitor's side before you commission new creative.
Accessibility Is a Revenue Issue
Recent UK research reported by Ecommerce News UK on website accessibility barriers found 76% of shoppers with disabilities have been prevented from completing purchases by accessibility issues during major sales periods. It also reported 57% of all UK consumers say such problems would discourage online shopping, while 62% of Scottish shoppers report being deterred by these issues. Common barriers include small text, confusing navigation and slow-loading pages.
Run a keyboard-only pass through checkout, then repeat the journey on a phone with enlarged text. Note every point you can't reach, read or complete. That list is a conversion backlog, not a compliance side project, and it connects directly to sound user experience design practice. Treat each survey figure as a likelihood, not a promised uplift. Tie one barrier to one funnel event, fix it, then measure that event again.
How to Test Changes Without Guessing
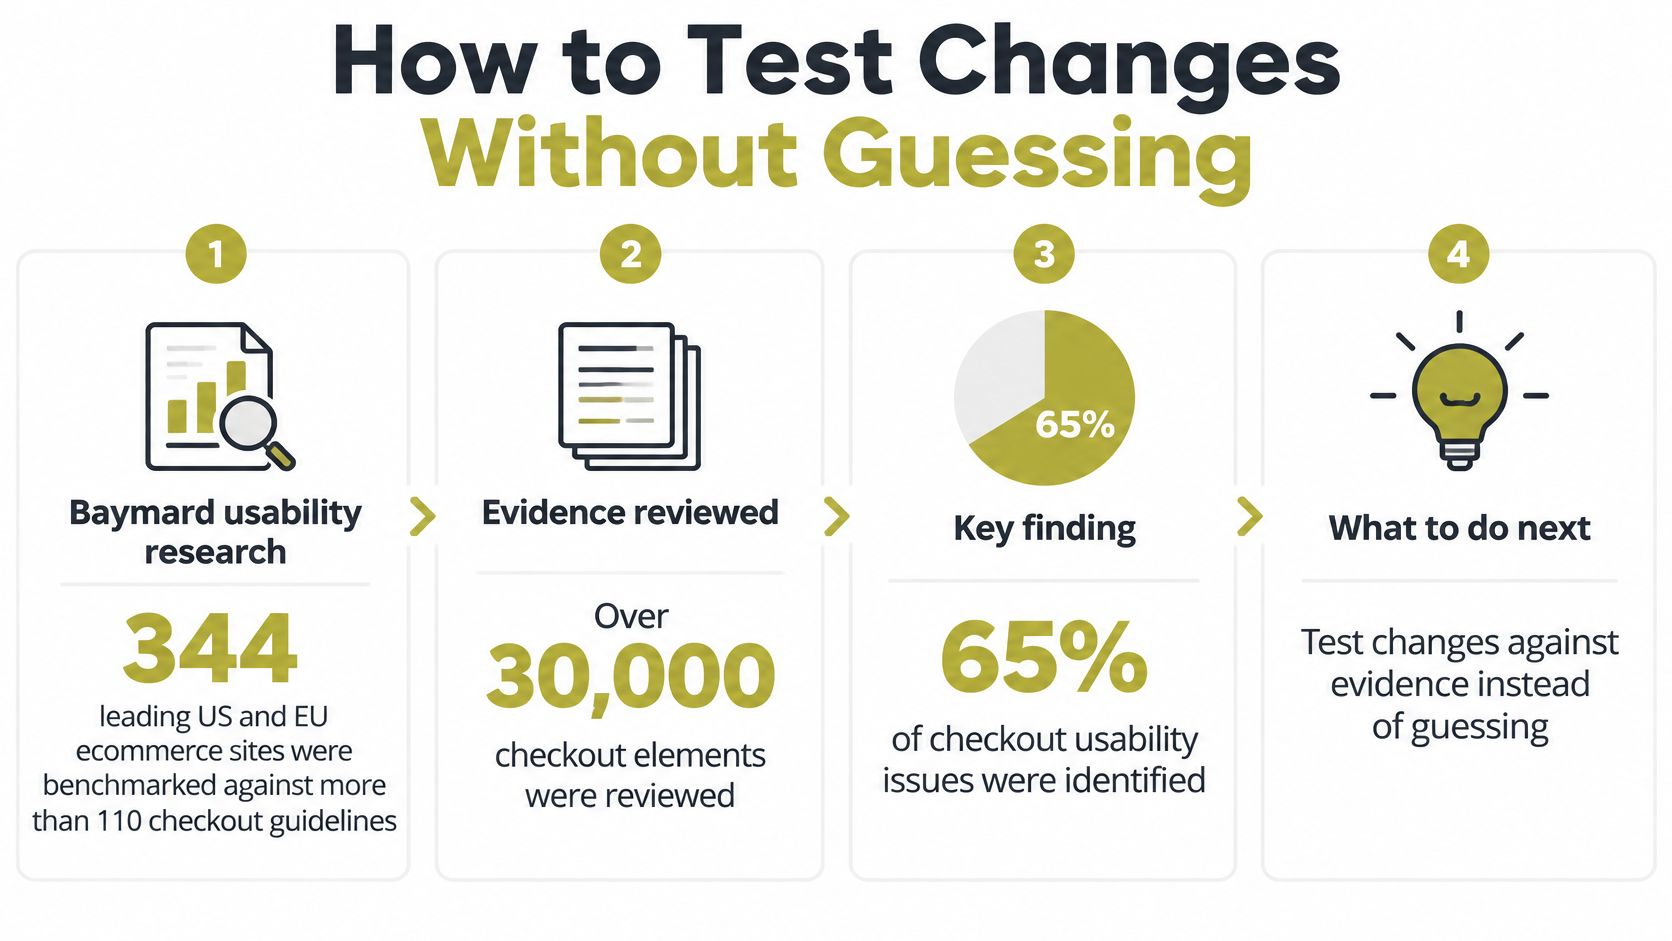
Checkout usability is measurable, and the evidence for fixing it is unusually concrete. Baymard Institute's checkout usability research benchmarked 344 leading US and EU ecommerce sites against more than 110 checkout guidelines, reviewing over 30,000 checkout elements. It found 65% of sites had mediocre-or-worse checkout performance, while only 2% were rated good. If leading retailers score that poorly, a smaller UK site shouldn't assume its checkout is fine because it functions.
Baymard's testing also indicates the average large ecommerce site has about 32 checkout improvements available and could achieve an estimated 35% conversion-rate increase through better checkout design alone. Read that carefully. It's a potential improvement from usability testing, not a UK benchmark and not a promise for your traffic. You still have to validate it with your own visitors, devices and payment mix.
The infographic below sets out the testing discipline that turns that research into a local result.
A Controlled Test Procedure
- Isolate one friction source: Pick a single cause, such as a forced account creation step, so the result has one plausible explanation.
- Define the funnel event: Name the event it should affect, for example payment completion, before you build anything.
- Build a controlled change: Change that element only, and keep price, traffic source and promotion steady where you can.
- Run an A/B test: Keep it running until the sample is large enough to detect a meaningful difference, not until the graph looks encouraging.
- Compare commercial outcomes: Judge completed orders and revenue per visitor, not clicks or form progression alone.
Start with tests that remove known friction. Try guest checkout, field and page reduction, transparent total pricing and inline validation first. Then test trust and returns information, mobile keyboard behaviour and payment-method visibility. Report sample size and device mix beside every result, because a test that wins on desktop can lose on mobile.
Commercial check: A higher order rate is worse if average order value falls far enough to cut revenue per visitor.
That warning changes what counts as a win. A discount-led variant may lift orders while training buyers to spend less. Keep the variant only if the full commercial picture improves.
Fix the Copy at the Widest Gap
A checkout can lose more orders to one ambiguous delivery line than to its layout. Once you know the drop-off stage, fix the words closest to it. Copy cannot rescue a broken payment step, but it can remove doubt at the moment a visitor decides. Use four steps in this order.
First, write the headline as the outcome the visitor wanted, in their words, aimed at one action. Second, label the button with that action instead of a vague submit. Third, place one proof line by the price that says who is selling, how payment is taken and when delivery happens. Fourth, keep a second version and change only that line.
Score both versions on completed orders and revenue per visitor across four weeks. Do not score them on clicks, because a clearer button can attract clicks from people who were never going to buy. The guide to how to write web copy covers the drafting side in more detail. If the proof line moves orders, the barrier was doubt. If it does not, check delivery and accessibility before redesigning the page.
Choose the Page by the Gap
If the widest gap sits between the visit and the add-to-cart or enquiry, test landing-page copy before you buy more traffic. If the widest gap sits inside checkout, leave the headline alone. Change one checkout sentence instead, such as the delivery promise or the payment line, and watch payment completion. A service firm that gets strong product views but weak enquiries, for example, should test a headline that names the outcome plus a proof line naming who will respond and when. Rewriting the footer is not a fair test.
Claims beside a price need an editorial standard, because an uncheckable reassurance can deepen suspicion. Carlos Alba Media is founded and run by Carlos Alba, a multi award-winning former national newspaper editor, and it provides senior-level counsel without big-agency overheads. That newsroom background matters for verification. In the National Council for the Training of Journalists' Journalists at Work 2024 survey of more than 1,000 working UK journalists, 79% felt they had appropriate skills to verify sources from social and digital media, while only 6% disagreed.
Experience compounds that skill. The Reuters Institute study of UK journalists in the 2020s found 46% of respondents had worked in journalism for more than 20 years. Trust also depends on process. A Reuters Institute fellows paper on trust in news reported only 36% of people trusted most news most of the time, while 60% trusted BBC reporting, with credibility of the journalistic process and credibility of content among the strongest drivers. Put only a checkable claim beside the price, name who is responsible for it, and let the test decide whether it earns its place.
If your site attracts visits but too few orders or enquiries, Carlos Alba Media can diagnose the widest funnel gap and fix the copy, trust signals and page experience around it. Carlos Alba Media offers media exposure, digital content marketing, social media marketing, web design and development, media crisis management and media skills training, and has completed 100+ web development projects. Visit Carlos Alba Media to start with the evidence your own analytics already hold.