Most advice about social media engagement is still stuck in a shallow playbook. Count likes. Watch follower growth. Celebrate a post that “did well”. Then move on.
That's not measurement. That's scorekeeping without context.
At Carlos Alba Media, we approach social data with a different instinct. Our team is made up of former national news journalists and agency specialists who've worked with international brands, so we don't just ask what happened. We ask what the numbers are telling us, what they leave out, and what decision they should trigger next. The useful question isn't whether a post attracted attention. It's whether that attention meant anything.
Beyond Vanity Metrics The Real Purpose of Engagement
A high like count can flatter a marketing team and still tell you very little. It might reflect paid distribution, a broad but irrelevant audience, or a creative format that generated a quick reaction without driving any meaningful next step.
That's why serious measurement has moved on. UK social reporting no longer treats engagement as a single count to admire in isolation. As a peer-reviewed review notes, practice shifted from simple counting to multi-metric analysis, with practitioners using quantitative metrics and normalised indexes, then pairing engagement rate with click-through rate, follower growth and share of voice to connect activity to business outcomes (peer-reviewed review on social media engagement measurement).
Why raw numbers mislead
A post with more reactions isn't automatically the stronger post. If one piece of content reached a much larger audience, its engagement total may look better because more people saw it.
A smarter reading asks:
- Who saw it: Was reach broad, narrow, paid, organic, local, or mixed?
- How they responded: Did they click, comment, save, share, or just tap like and leave?
- What happened next: Did the interaction support awareness, traffic, leads, or reputation?
Practical rule: If a metric can't help you make a decision, it doesn't belong at the centre of your report.
A journalist's mindset matters. In a newsroom, a single number never stands on its own. You check the source, compare it with the baseline, look for what changed, and ask whether the headline hides the true story. Social analytics works the same way.
Engagement is a signal, not the outcome
Engagement matters because it shows audience response. It doesn't matter because it looks busy.
For some brands, the strongest signal is a save because it suggests utility. For others, it's a share because it expands reach into trusted peer networks. For a B2B firm, a click from a LinkedIn post may be worth far more than a pile of reactions on Instagram.
If you're refining your approach to tracking social media interactions, it helps to treat engagement as evidence within a wider reporting system, not as the final verdict. That's also why brands that want stronger performance usually need sharper planning, editorial discipline and clearer social media engagement strategies, not just more posts. Carlos Alba Media explores that broader planning in its guide to social media engagement strategies.
The purpose of engagement measurement is simple. It tells you whether your content is earning attention from the right people in the right way, and whether that attention is moving your business forward.
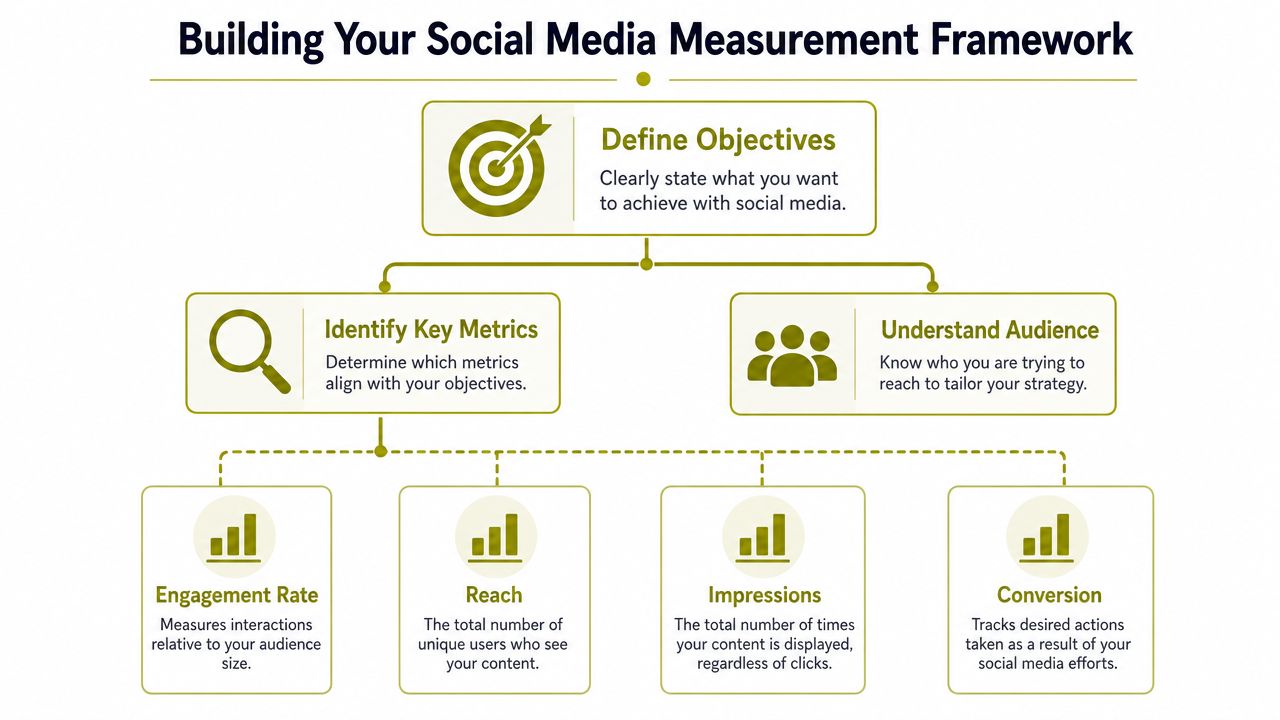
Building Your Measurement Framework Before You Track
Most reporting problems start before the first post goes live. Teams open Meta Business Suite, LinkedIn Analytics or TikTok Analytics and begin pulling numbers without deciding what they're trying to prove.
That creates bloated reports and weak decisions. If your objective is unclear, every metric looks vaguely important.
Start with the business goal
Social media measurement should begin with a commercial or strategic aim, not with a platform dashboard.
A useful framework usually starts with questions like these:
- Need more awareness: Do you want more relevant people to recognise your brand?
- Need stronger consideration: Do you want prospects to visit your site, compare options or spend time with your content?
- Need more conversion activity: Do you want enquiries, bookings, demo requests or sales conversations?
Once the business goal is clear, translate it into a social objective. That translation step is where many brands go wrong.
A tourism business may say it wants “more bookings”, but on social the more immediate objective might be stronger click intent on seasonal offer posts. A tech SME may say it wants “better visibility”, but in practice it may need more engagement from the right job titles on LinkedIn.
Match the metric to the stage
Here's the cleanest way to organise it.
Awareness metrics tell you whether content is being seen and circulated. Reach, impressions and share of voice sit here.
Consideration metrics show whether people are leaning in. Engagement rate, saves, comments, profile visits and click-through behaviour matter more at this stage.
Conversion-adjacent metrics indicate movement towards action. Link clicks, landing page visits, enquiry form starts and demo-page traffic are more useful than applause metrics.
Strong measurement frameworks are selective. They don't track everything available. They track what answers the business question.
Document the rules before reporting
A good framework also needs consistency. Decide in advance:
Your primary KPI
One lead metric for the campaign or reporting period.Your supporting metrics
A small set that explains performance without clutter.Your audience segments
New versus existing audiences, local versus national, paid versus organic, or platform by platform.Your reporting cadence
Weekly for tactical adjustments. Monthly for pattern recognition.
Without those rules, teams change the definition of success after the results come in. That's how vanity metrics creep back into the conversation.
A measurement framework should be short enough that any stakeholder can read it and understand what success looks like. If it takes a long meeting to explain, it's too loose.
Calculating the Engagement Metrics That Matter
Once the framework is in place, calculation becomes straightforward. The mistake is to think the calculation alone is the strategy. It isn't. But you still need clean maths.
In UK practice, the foundational formula is engagement rate = (total engagements ÷ reach or impressions) × 100, because normalising by exposure allows a fairer comparison between posts with different distribution levels. That matters in a market where adults aged 16+ spend an average of 1 hour 29 minutes per day on social media, making rate-based measurement more useful than raw totals alone (UK engagement measurement guidance).
What counts as an engagement
In most practical reports, total engagements include a combination of:
- Likes or reactions
- Comments
- Shares or reposts
- Saves
- Clicks
Not every platform weights these actions equally in real-world value. A like is low-effort. A share often extends reach. A save usually signals lasting usefulness. A click suggests intent beyond the platform.
The three common formulas
Use one method consistently for comparison. Mixing them inside the same report creates confusion.
| Formula | Best use | Trade-off |
|---|---|---|
| Engagement rate by reach = total engagements ÷ reach × 100 | Comparing how well content landed with unique people who saw it | Depends on reliable reach data from the platform |
| Engagement rate by impressions = total engagements ÷ impressions × 100 | Assessing performance where repeat exposure matters | Repeat views can make a post look weaker than it felt in practice |
| Engagement rate by followers = total engagements ÷ followers × 100 | Tracking audience responsiveness over time | Less useful when only a fraction of followers actually saw the post |
A worked example for a Scottish gin distillery
Take a fictional Instagram post from a Scottish gin distillery promoting a limited-edition bottle with a cocktail serve video.
Assume the post generated likes, comments, shares, saves and clicks. Add those actions together to get total engagements. Then divide that total by either the post's reach or impressions, depending on the method you've chosen, and multiply by 100.
If the marketing team wants to compare this post against other posts from the same campaign, engagement rate by reach is often the cleaner option. It shows how many of the people exposed to the content took an action.
If the team wants to assess how repeated exposure affected performance across paid and organic distribution, engagement rate by impressions may be more useful.
What matters most is consistency. If the distillery reports by reach in January, by followers in February, and by impressions in March, the trend line becomes hard to trust.
The formula should stay stable long enough to show a pattern. If the denominator keeps changing, the insight disappears.
Platform nuance matters
A generic engagement report misses the fact that each platform rewards different behaviour.
| Platform | Primary Metric | Secondary Metrics | Business Goal Alignment |
|---|---|---|---|
| Saves | Shares, comments, clicks | Educational content, product interest, brand affinity | |
| Shares | Comments, clicks, reactions | Community reach, local awareness, event visibility | |
| Comments and shares | Clicks, reactions | Authority, lead generation, professional relevance | |
| TikTok | Comments | Shares, saves, profile visits | Discovery, audience learning, creative resonance |
| Saves | Clicks, outbound traffic | Consideration, inspiration, product planning |
That's why platform expertise matters. A LinkedIn post with thoughtful comments from relevant decision-makers may outperform a more visible Instagram post in business terms. If you need support turning that kind of platform-specific analysis into reporting and action, Carlos Alba Media outlines its approach as experts in social media.
What works and what doesn't
What works
- Comparing like with like
- Reading engagement by content format
- Separating paid and organic results
- Looking at engagement together with clicks and conversions
What doesn't
- Reporting one blended engagement number across every platform
- Treating all interactions as equal
- Judging success by follower count alone
- Celebrating spikes without checking why they happened
Good measurement is precise. Better measurement is precise and useful.
How to Set Realistic Benchmarks and Targets
The question clients usually ask after calculating engagement rate is simple. Is that good?
The honest answer is that external benchmark numbers can give rough context, but your own baseline is usually more valuable. A business with a niche, highly relevant audience may perform very differently from a broad consumer brand, and that difference doesn't mean the strategy is weaker.

Build your baseline first
Start by reviewing your recent reporting period and grouping content by platform, topic, format and objective. You're looking for patterns, not perfection.
Focus on questions such as:
- Which posts consistently earn useful engagement
- Which formats attract clicks rather than passive reactions
- Which themes lead to comments, shares or saves
- Which campaigns reached the right audience but failed to prompt action
That becomes your operating baseline. It's more credible than chasing a generic industry average that may have little to do with your market, budget or audience quality.
A Highland hotel example
Take a boutique hotel in the Scottish Highlands promoting a winter getaway package. The team wants bookings, but social media rarely delivers that outcome in one clean jump. More often, it supports discovery, consideration and intent.
A sensible benchmark process would look like this:
- Review past seasonal campaigns and isolate similar offer-led posts
- Identify the best indicators of booking intent, such as clicks to the package page, shares to travel-planning partners, and saves for later decision-making
- Set a realistic target above the existing baseline for those intent signals, rather than aiming for a vague rise in “engagement”
- Watch audience quality, not just volume, to see whether the campaign is attracting likely guests
The hotel may find that its prettiest scenic posts generate broad approval but limited commercial value. Meanwhile, a practical post about availability, itinerary ideas or what's included in the package may drive fewer reactions but more useful action.
A benchmark is only helpful if it reflects the kind of response your business actually needs.
This short explainer is a useful complement if you want to sense-check how teams think about targets and reporting in practice.
Set targets that can survive scrutiny
Weak targets sound impressive and collapse under questioning. Strong targets are specific enough that the team knows what to optimise.
A practical target should define:
The metric
For example, share rate, saves, qualified clicks, or engagement rate by reach.The audience or campaign segment
Organic Instagram audience, paid LinkedIn campaign, or regional Facebook promotion.The timeframe
Weekly, monthly, or campaign period.The business meaning
Why this target matters to awareness, lead generation, bookings or reputation.
Experienced practitioners separate signal from noise. A target that looks modest on paper may be commercially stronger than a flashy engagement goal if it captures better intent.
Tools and Dashboards for Efficient Social Media Reporting
Manual reporting breaks down fast. The first few spreadsheets feel manageable, then the tabs multiply, definitions drift, and nobody agrees on which version is current.
The fix isn't merely buying more software. It's choosing tools that support a cleaner reporting method.
Use native analytics before you add complexity
It's often best to begin with the built-in analytics from the platforms they already use.
- Meta Business Suite gives you post-level performance, reach, impressions and interaction data across Facebook and Instagram.
- LinkedIn Analytics is useful for professional audience response, post engagement and follower trends.
- TikTok Analytics helps you assess creative performance, audience response and profile-level activity.
These tools are often enough for early-stage businesses and focused campaigns. They're closest to the platform data, and they help you verify what content achieved before exporting anything into a broader report.
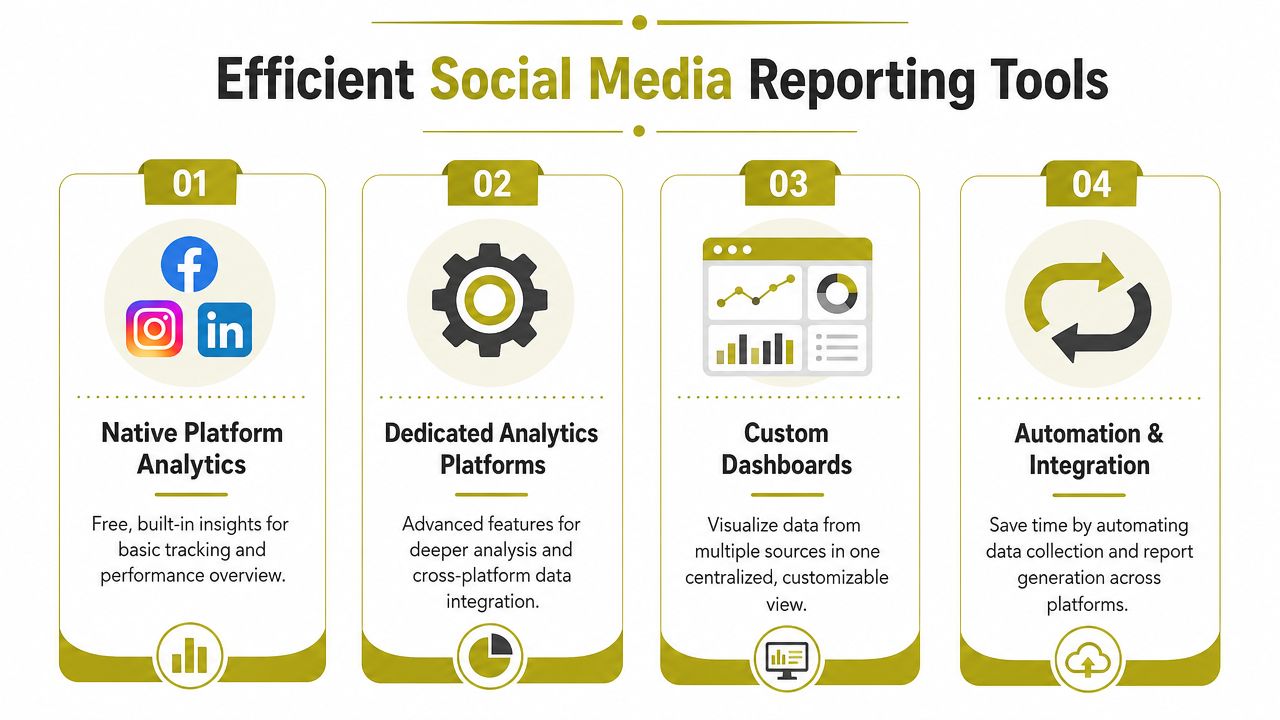
When third-party dashboards make sense
A broader dashboard becomes useful when you need cross-platform reporting, easier comparisons, or automated views for stakeholders.
That usually means one of two routes:
| Tool category | What it does | Best fit |
|---|---|---|
| All-in-one social suites | Brings publishing, listening and analytics together | Teams managing multiple platforms daily |
| Data visualisation tools | Pulls data into a cleaner custom dashboard | Teams that want executive reporting without platform clutter |
Hootsuite and Sprout Social sit in the first group. Looker Studio sits in the second. If your team is building more custom integrations, Mallary.ai's review of social media APIs is a useful primer on the kinds of API options developers evaluate when connecting platforms and reporting systems.
For brands running paid campaigns alongside organic reporting, it also helps to align the social dashboard with promotion data rather than keeping those performance views separate. Carlos Alba Media covers that overlap in its overview of paid social services.
The one-page dashboard rule
The best reporting dashboards are shorter than typically expected by teams.
A strong one-page dashboard usually includes:
- Trend over time so performance can be judged in context
- Top-performing content with a brief reason it worked
- Core metrics only tied to the original objective
- Key takeaway written in plain English
- Recommended action for the next reporting period
If a stakeholder can't understand the report in a few minutes, the dashboard is serving the analyst, not the business.
That's where agency experience matters. The goal of a dashboard isn't to display every available metric. It's to reduce complexity until the next decision becomes obvious.
Turning Your Data into Actionable Decisions
A good report should lead to action. If it doesn't change content, targeting, timing, spend or message, it's just documentation.
The most useful rhythm is usually a mix of weekly checks and monthly review. Weekly reporting helps teams adjust creative, posting patterns and paid support while a campaign is still live. Monthly review is where you step back, compare content themes, and decide what to repeat, refine or cut.
What to review every month
A monthly insights summary doesn't need much jargon. It needs clarity.
What improved
Identify the formats, themes or platforms that produced stronger business-relevant engagement.What weakened
Note where reach held up but action dropped, or where content drew attention from the wrong audience.What mattered most
Pull out the few metrics that align with the campaign objective.What changed next
Recommend a specific adjustment in content mix, targeting, creative angle or reporting focus.
A LinkedIn example from a Scottish tech SME
A Scottish tech SME using LinkedIn might begin with a broad mix of product updates, team news and industry commentary. After a few reporting cycles, the pattern may become obvious. Product posts attract polite reactions. Practical thought-leadership posts generate stronger comments, more saves, and better click intent from relevant decision-makers.
That should shape the next quarter's content pillars.
Instead of posting more often, the smarter move is to publish more of what earns qualified attention. In practice, that often means reducing low-value updates, sharpening the point of view, and writing posts that answer buyer questions rather than broadcasting company activity.
Data becomes useful when it gives you permission to stop doing work that looks busy but doesn't move the brand forward.
That's the difference between passive reporting and strategic measurement. The first describes the past. The second improves the next campaign.
At Carlos Alba Media, that's the standard. Bring newsroom curiosity to the numbers, question easy narratives, and use evidence to make faster, better decisions.
If you want senior-level help building a reporting framework that connects social engagement to real business outcomes, speak to Carlos Alba Media. The team combines former national news journalists with agency specialists who've worked with international brands, helping organisations turn social data into clear decisions, stronger campaigns and measurable growth.