

You've just opened Search Console, clicked into Core Web Vitals, and found a wall of red URLs. The report mentions a 75th percentile and something called INP, and the quote for fixing all of it runs to four figures. Meanwhile, the enquiry form on your site takes about a second to respond when a customer taps Submit on an Android phone, and nobody has looked at that yet.
That gap between a dashboard summary and what a real customer feels is where most performance work goes wrong. Core Web Vitals are a diagnostic signal, not a score to chase across every URL you own. Used properly, they tell you which pages frustrate the people most likely to buy from you, in the conditions those people browse in.
Plenty of Core Web Vitals explained content stops at definitions and leaves you to work out what to do on Monday morning. This one is built around decisions: the thresholds you can check today, what each metric really measures, why lab tests and real-user data disagree, and the order of fixes that holds up on UK mobile connections.
Core Web Vitals Thresholds at a Glance
| Metric | Good | Needs improvement | Poor |
|---|---|---|---|
| LCP (loading speed) | 2.5 seconds or less | 2.5 to 4.0 seconds | Over 4.0 seconds |
| INP (responsiveness) | 200 milliseconds or less | 200 to 500 milliseconds | Over 500 milliseconds |
| CLS (visual stability) | 0.1 or less | 0.1 to 0.25 | Over 0.25 |
Those three rows are the whole scoring system in miniature, and they're user-centred rather than technical. A good result means a largest contentful paint of 2.5 seconds or less, an interaction to next paint of 200 milliseconds or less, and a cumulative layout shift of 0.1 or less, measured at the 75th percentile of relevant visits, as set out in Google's Search Console documentation on the Core Web Vitals report.
The percentile rule is where confusion often sets in, so here it is in plain terms. Sort every visit to a page from fastest to slowest and take the value three quarters of the way along the line. That single visit decides pass or fail, which means three in four visits must hit the good level before a page counts as good.
It also means a slow tail of one visit in four is built into the system as acceptable. On a small UK site, that tail is often your most impatient customer, on a phone, in a poor signal area.
Mobile and desktop are judged as separate populations. A page can sit comfortably green on desktop and fail on mobile, and the mobile result is the one that reflects what most of your customers get.
If you sell online, benchmark against a like-for-like reference rather than a generic content site, because commerce templates carry different third parties and heavier product imagery. These speed benchmarks for Shopify Plus stores give you a fair comparison point when a storefront rather than a brochure site is the page under review.
One line to strike from your reading list: INP replaced First Input Delay as a Core Web Vital in March 2024. Guides that still list FID as the responsiveness metric haven't been updated, and FID only ever measured the first interaction of a visit, which told you almost nothing about a checkout flow.
Before you touch anything, take the one page that takes money or enquiries, check its three metrics on mobile, and mark each one good, needs improvement or poor. Whichever fails first is your work queue.
What Each Metric Measures and Why
Three metrics, three different failures, three different fixes. Confusing them is why performance projects stall: someone compresses images to solve a responsiveness problem and nothing improves.
The diagram below maps each metric to the visitor experience it describes.

LCP, the main course arriving
LCP is the moment the main course lands on the table. It measures when the largest visible element on the page, usually a hero image, a banner or a big block of heading text, finishes rendering. Until that moment the visitor is looking at a half-built page, which is why LCP tracks perceived load speed far better than total page weight does.
When it's slow, the fault sits in the delivery path for that one asset: a sluggish server response, render-blocking CSS or JavaScript queued ahead of it, an image several times heavier than the space it fills, or caching that isn't doing its job.
INP, the lag after the light switch
Flick a switch and the room should light up instantly. If the bulb hesitates, you flick again, and that second flick is exactly what INP catches. The metric measures the gap between a tap, click or key press and the visible response, across the whole visit, and reports close to the worst interaction rather than an average of them all.
The visitor feels it as a button that didn't seem to register. The problem sits on the main thread: long JavaScript tasks, heavy third-party scripts, and event handlers doing far more work than the action deserves.
CLS, the tablecloth pulled while you eat
Someone tugs the tablecloth mid-meal and everything slides. CLS adds up every unexpected movement of visible content, scoring each shift by how much of the screen moved and how far it travelled. The visitor feels it when their thumb lands on the wrong link because a consent banner shoved the page down a fraction of a second earlier.
The problem sits in space that was never reserved: images without dimensions, late-loading embeds, banners injected above existing content, and fonts that swap in after the first render.
A page can fail one of these and pass the other two without any contradiction, because each one points at a different part of the build. Our guide to what web performance means for a business puts those three signals in the wider context of hosting, caching and conversion.
Keep this line: fix the metric that frustrates your most valuable visitor first, not the one that looks worst on a dashboard.
Lab Tests Versus Real User Data
A page can pass a lab test on office Wi-Fi and still feel slow to someone using an older phone on a weak connection. Lab and field measurements answer different questions, so neither should stand alone.

Lighthouse runs a controlled test on a set device and throttled connection. Repeatable results help diagnose causes and catch regressions in a build pipeline. Field data records actual Chrome users. The Chrome User Experience Report (CrUX) aggregates those visits over a rolling window, and Search Console's Core Web Vitals report groups similar URLs to show how templates perform.
GOV.UK publishes findings from its real user monitoring, offering a useful UK example. It began collecting the data on 16 June 2021. In April to May 2022, its median page load across pages and devices was 0.455 seconds. Its own measure classed a load as fast for 83% of visitors, as reported in GOV.UK's one-year review of real user monitoring. That one-second measure is GOV.UK's, not CrUX's definition of good LCP.
The median hides slower experiences: the slowest users saw loads of 2.35 seconds. Android phones accounted for 36% of slow visits, while devices with 4GB of memory made up 33% of that group. A strong middle-of-the-pack result can still conceal a problem for particular devices.
The three-minute walkthrough below compares a controlled audit with what visitors experienced.
Connection quality adds another variable. Ofcom defines good mobile performance as at least 5 Mbit/s download, 1.5 Mbit/s upload and one-way latency of no more than 50 milliseconds. Its research found those conditions were met 81% of the time, ranging from 82% in England to 81% in Northern Ireland, 79% in Scotland and 76% in Wales, according to the Ofcom Mobile Matters report. The same page can perform differently for users in Cardiff and central London.
If you collect your own field data, start by prioritizing RUM metrics like LCP. LCP helps identify when the main content arrives for visitors on the devices and connections they use.
Rule of thumb: use lab tools to find the cause, then check real UK mobile user data to see whether the fix worked.
Field data can lag a release by days or weeks, so the morning after launch is too soon to judge a change. Low-traffic pages may not have enough field data to report. In that case, use lab tests to investigate and analytics to track relevant user journeys until a larger sample is available.
What Core Web Vitals Mean for SEO and Sales
A green report is a good sign. It is not a payday. Page experience is one input among many, and content relevance plus authority still decide most results. Core Web Vitals matter at the margins, between two pages that are equally relevant and equally well written.
The assumption worth challenging is that passing site-wide produces revenue. The evidence is thinner than the marketing suggests, and the mobile picture explains why.
Where the mobile gap bites
UK-focused benchmark reporting shows how uneven the ground is: 48% of mobile sites were reported as passing all three Core Web Vitals, against 56% on desktop, while mobile LCP passed for about 62% of sites, according to SQ Magazine's collection of web design statistics. Mobile is harder because the same page asks a smaller processor and a weaker connection to do the same work.
Weight is the reason. The 2025 Web Almanac figures cited in that reporting put the median mobile home page at 2,362 KB, including about 632 KB of JavaScript and 911 KB of images. Every one of those bytes has to be downloaded, parsed, decoded and executed on a phone before a customer sees anything useful.
Connect the metric to the money
Say a bakery has a beautiful homepage hero that renders in four seconds, but the enquiry form on its catering page takes 600 milliseconds to respond after a tap. The hero is visible to everyone; the form is where the money is. Fixing the slow hero first would improve the score and change almost nothing commercially.
That's why I'd sequence the work by journey rather than by page count. Start with checkout, booking and enquiry forms, then service landing pages, then the homepage. A website conversion audit is the right frame for this, because it asks what the visitor was trying to do on that page before it asks how fast the page was.
The measurement that settles arguments: pull each key page's conversion rate for the last four weeks and place it beside the same page's mobile field data for the same weeks. If the slowest pages aren't the worst converters, your constraint is somewhere else.
The test that matters: if a page earns enquiries, its 75th percentile mobile experience is a business number, not a technical one.
How to Fix Poor LCP, INP and CLS
Order matters more than the length of your fix list. Work through these in sequence and stop when the metric you care about moves out of poor.
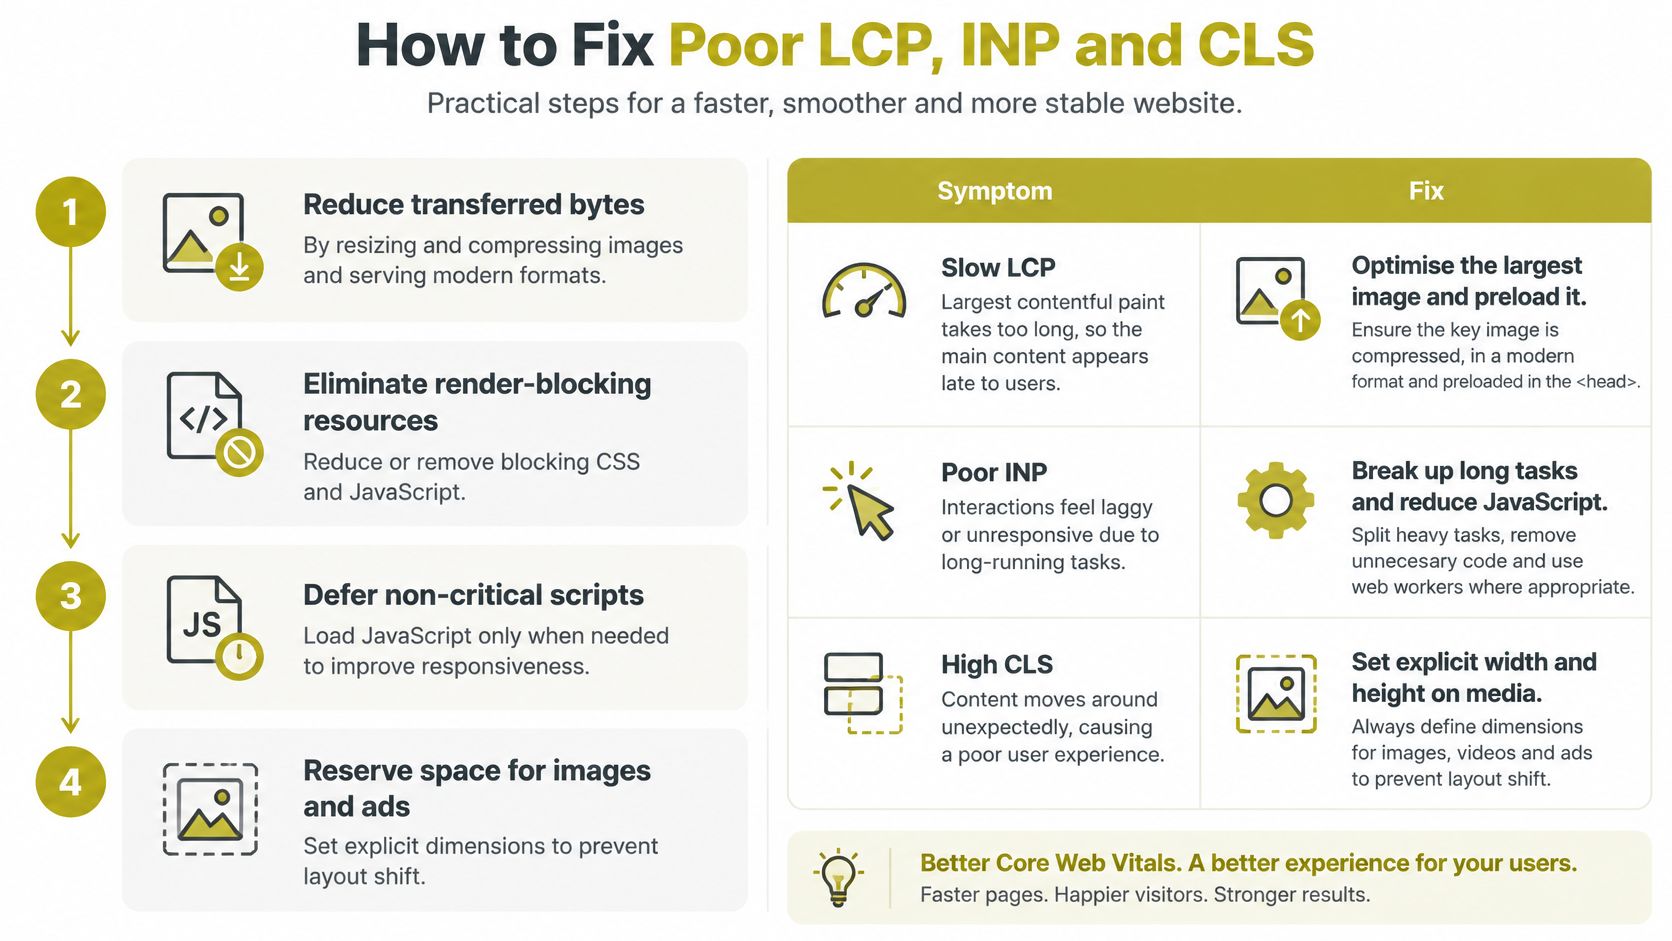
Cut transferred bytes. Resize and compress images, serve modern formats such as WebP or AVIF, and delete JavaScript nothing uses. Weight is the cheapest win available. The common slip is compressing a 2,000-pixel hero that renders at 400 pixels, which saves less than resizing it first.
Fix server response and caching. Put a CDN in front of the site, cache HTML where your platform allows it, and remove redirect chains. The reason is blunt: no amount of image optimisation rescues a slow origin. The slip is adding a CDN but leaving pages uncached, so every visit still queues at the server.
Preload the hero image and the key font, and defer render-blocking CSS and scripts. This is the step that turns a technically fast page into one that looks fast. The slip is preloading five assets, which tells the browser everything is a priority and therefore nothing is.
Break up long JavaScript tasks. Defer or remove third-party scripts that don't earn their place, and yield to the main thread during interactions. The slip here is real: ripping out a consent banner or a booking widget to win back milliseconds, when either may carry a compliance or conversion role you haven't checked.
Reserve space for images, embeds, banners and consent tools. Set width and height attributes, use fixed containers for anything injected, and match fallback fonts to the intended ones. The slip is inserting a late-loading promotional banner above existing content, which shifts everything below it at the worst possible moment.
Retest on a mid-range Android phone and check field data after release. A desktop Lighthouse run is not evidence. The slip is declaring victory on a laptop while the phone in your hand still hesitates.
| Symptom | Likely cause | Fix |
|---|---|---|
| Main image or heading appears after 4 seconds | Oversized image, slow server response | Resize and compress the image, use a CDN and cache HTML |
| Taps and clicks feel delayed on mobile | Long JavaScript tasks, heavy third-party scripts | Split code, defer non-essential scripts, yield to the main thread |
| Text jumps as the page loads | Images and embeds without dimensions, late banners | Set width and height, reserve space for ads and consent banners |
| Paragraphs shift when fonts load | Web fonts load late and swap in | Preload the key font, use font-display and matched fallback fonts |
| Good in the lab, poor in the field | Real mobile networks, older devices, consent tools | Segment field data by device and test on a mid-range Android phone |
Once a change ships, field-data monitoring for real visitors is how you confirm it worked, because the 75th percentile on a real device mix is the only number your customers recognise.
Tools for Monitoring Core Web Vitals
| Tool | Data type | Best use | Main limitation |
|---|---|---|---|
| PageSpeed Insights | Lab and field, where available | Quick page check with diagnostics | Field data missing for low-traffic pages |
| Search Console Core Web Vitals report | Field (CrUX) | Site-wide grouping of similar URLs | Updates with a lag and needs a verified property |
| Chrome User Experience Report | Field, public dataset | Benchmarking origins against competitors | Chrome users only, aggregated monthly |
| Lighthouse | Lab | Debugging and CI performance budgets | Single simulated test that does not show real visitors |
| web-vitals JavaScript library | Field, in your own analytics | Per-page-template real-user monitoring | Needs implementation and data storage |
The distinction that matters: lab tools help you debug, field tools tell you whether it worked, and real-user monitoring shows the 75th percentile by template rather than one number for the whole site.
A routine that takes twenty minutes a month
- Monthly: open the Search Console report, read the mobile tab first, and note any template that has slipped from good to needs improvement.
- Before and after each release: run PageSpeed Insights on the changed templates, so you have a lab before-and-after alongside the field trend.
- Set budgets at the thresholds: LCP under 2.5 seconds, INP under 200 milliseconds, CLS under 0.1, enforced in CI rather than agreed verbally.
- Benchmark against rivals: compare two or three direct competitors' field data for the same page types, not a generic industry average that describes nobody in your sector.
One confusion is worth clearing up early. A PageSpeed score can differ sharply from CrUX because one is a simulated run and the other is a crowd. CrUX is built from opted-in Chrome users, so Safari and Firefox visitors never appear in it, and Google's experimental Core Web Vitals variants now add soft-navigation metrics for single-page apps. Running a side-by-side website speed comparison across several origins makes the sample question concrete: several sites, several different visitor mixes, one test each.
Confirm Your Priorities Before You Fix Anything
A slow checkout deserves attention before a low-traffic page with the same Core Web Vitals issue. Start with the journeys that matter to the business, then use performance data to decide what to fix.

- Choose three to five commercially important pages. Include journeys such as checkout, booking, a quote form or a main service page. Prioritise pages that help visitors take a meaningful next step.
- Check mobile field results for those pages. Use the relevant URL groups in Search Console and compare their 75th-percentile results with the Core Web Vitals thresholds. A site-wide score can hide a problem on one important journey.
- Match the fix to the failing metric. Use the relevant recommendation from the fixes table, then check the changed page on a mid-range Android device before taking on another task.
- If priority pages pass, spend the effort elsewhere. Review the proposition, form accessibility and trust signals instead. A strong score on a page that contributes little to customer journeys is unlikely to be the best use of a sprint. The SEO audit checklist can help structure that wider review.
Mobile should be part of the decision. GOV.UK recorded 61% of monthly visits from mobile devices by December 2025, compared with 38% from desktop, according to Make It Flow's analysis of the 2025 Web Almanac data. Booking widgets and consent banners can affect INP and layout shift. Removing them may also affect compliance or conversion, so weigh both outcomes before changing them.
Carlos Alba Media, founded and run by former national newspaper editor Carlos Alba, has completed 100+ web development projects. Webbuilder Jamie Sterling brings 10 years of experience to the build side. Judge performance work by whether it helps a real UK customer complete an enquiry, not by the score alone.
Export the Search Console report and run the priority pages through PageSpeed Insights. Review both together before assigning development work.
Carlos Alba Media works with start-ups, SMEs and established brands across Scotland and the UK on website performance and conversion. If your Search Console report shows problems you cannot prioritise, contact Carlos Alba Media to discuss which pages are worth fixing first, based on what customers do on them.